Welcome!

This blog provides commentary on interesting geological events occurring around the world in the context of my own work. This work is, broadly, geological fluid dynamics. The events that I highlight here are those that resonate with my professional life and ideas, and my goal is to interpret them in the context of ideas I've developed in my research. The blog does not represent any particular research agenda. It is written on a personal basis and does not seek to represent the University of Illinois, where I am a professor of geology and physics. Enjoy Geology in Motion! I would be glad to be alerted to geologic events of interest to post here! I hope that this blog can provide current event materials that will make geology come alive.

Banner image is by Ludie Cochrane..

Susan Kieffer can be contacted at s1kieffer at gmail.com


Saturday, December 24, 2011

Happy Holidays all--and Enjoy "Santa Never Made it to Darwin" once again!

Hi, folks,

I hope that the holidays are happy for all, and send best wishes for 2012!

The Bill and Boyd song that you can find in the post below reminds us that natural earth processes don't actually know about holidays.

http://www.geologyinmotion.com/2011/01/cyclone-tracy-and-santa-never-made-it.html

Thursday, December 8, 2011

Power and energy of the Tohoku tsunami: Revised estimates.

Last March 12, a day after the Tohoku earthquake and tsunami, I posted an estimate of the power and energy in the tsunami, based on a rough estimate from observations at the time. My conclusion was that the energy was about 30 kilotons, roughly equivalent to the energy in the combined bombs that were dropped on Hiroshima and Nagasaki (36 kt). I felt that the energy could have been a factor of ten or a hundred higher given uncertainties in the height of the waves and duration of the event. Thanks to a reader's inquiry, here are some updated numbers based on data that has since emerged.

(Please give credit to this blog site if you use the numbers posted below!)

First, let me summarize the method.  Professor Michael McIntyre of the University of Cambridge calculated the power in a tsunami using Bernoulli's theorem, and concluded that under certain conditions the power in a tsunami is about 1 megawatt per meter of shoreline, or 1 gigawatt per kilometer.  The conditions are that the tsunami has a height of 1 meter in the open ocean, a velocity of 220 meters per second. I used these data directly and assumed a similar power, then estimated the length of shoreline attacked (one-half of the east coast of Honshu) and the duration of the tsunami (100-1000 seconds).  The model applies to tsunamis on the open ocean.

There are still not a lot of data available, but the velocity of 220 meters a second for the speed of the tsunami is in the right ballpark to account for the time between the earthquake and the time that it took for the tsunami to reach the coast (30-60 minutes).  The major uncertainty here is the height of the tsunami on the open ocean. I used the value of 1 meter that is typically used for tsunamis (because they are typically not even noticed on the open ocean). There were two ocean-bottom sensors in place that measured a height of 7 meters (Maeda, Takuto et al., Earth Planets Space, 63, 2011, in press) where the water was 1618 m and 1013 m deep respectively, and so I'll use a new value of 7 meters for the open-ocean height of the tsunami.

McIntyre's calculation of the power in the tsunami was based on an ocean depth of about 4.5 kilometers--deep open ocean.  In order to make my calculation internally consistent, I need to use shallower depth of, say 1.5 kilometers.The power, as calculated by McIntyre, is proportional to the depth to the three-halves power.

The height of the tsunami comes into the calculation as h-squared; the depth of the ocean as a square root.  Thus, the smaller ocean depth would reduce the power by a factor of 1.7 (sqrt 4.5/2) and the greater height of the tsunami would increase it by a factor of 49 (7 squared). The combined effects cause an increase of 28.8 in the power (let's round it up to 30).


To get energy from this, I assumed that the event lasted 100-1000 seconds, and that the length of coastline affected was about 1300 km. Both assumptions still seem reasonable. If you look at the map above of wave heights impacting Honshu, the northern half of the island, which is the half that I originally assumed was affected, has significantly greater wave heights than the southern half. Furthermore, for the model to be internally consistent, the number I really need is the length of the tsunami out on the open ocean not the amount of shoreline impacted. However, the assumption that the length of the tsunami was about equal to the length of the northern half of the island should give a ballpark estimate of the length at sea.

To summarize: I would increase my original estimate of the minimum power from  1.3*10^12 watts or 1.3 petawatts to 40 petawatts, and my original estimate of minimum energy to 40*10^14 joules or 930 kiloton, which could easily be rounded up to 1 megaton. These are the power and energy for an event of 100 seconds duration.  I believe that a more realistic duration is 1000 seconds, giving 400 petawatts and 10 megatons as the preferred values.  Note: Please See the first comment by a reader. Suggests that something between the min and max would be a better number to use.  So, perhaps best to say "a few hundred petawatts" and "a few megatons" given all of the uncertainties. 

 (For comparison, the 400 Pw and 10 Mt values are about 280 times the the combined energy of the bombs that destroyed Hiroshima and Nagasaki (15+21 kilotons.) The energy of the lateral blast at Mount St. Helens was about 24 megatons.)

Please see reader comments!


Tuesday, December 6, 2011

Tohoku tsunami IN THE PACIFIC was a "merged tsunami" (Or was it? Why did I put IN THE PACIFIC in capital letters? Read on!)

Left: Ocean heights as observed by two satellites.
Top: at 7:30 hours; Bottom, at 8:20 hours
Right: Computer simulations (black lines) and data
(red and purple lines) on the form of the tsunami.
NASA/JPL-Caltech/Ohio State University
The NASA press release is here.

The Fall meeting of the American Geophysical Union is in full swing and press releases are highlighting some interesting papers. One of these is on so-called "merged tsunamis," which I'll explain in a minute. However, if you Google "merged tsunamis" today, you'll find headlines like:

"Two merging tsunamis caused Japanese devastation" (TG Daily)

"Double Tsunami" Doubled Japan Destruction" (Eurasia Review)

"Rare "merging tsunami" contributed to Japan destruction" (Mother Nature Network)

Even mainstream newspapers:
"Japan was hit by a tsunami formed from TWO giant waves, reveal scientists" (Daily Mail, UK) (OOOPs, note added: one commenter pointed out that the Daily Mail should not be considered a mainstream newspaper...)

"Tsunami that struck Japan in March resulted from merging waves" (CNN, International)

Even academic publications:

"Merging tsunami" doubled destructive power along Japanese coast" (Environment360, from Yale.edu)


Many of the articles are accompanied by photos of the devastation on the coast of Japan.

But, wait a minute!! Here's the actual NASA/JPL news release. While the headline "NASA finds Japan tsunami waves merged, doubling power," might lead you to think that scientists are saying "The tsunami that hit Japan was caused by merged tsunami waves, doubling the power...", that is, in fact, not what the text of the article, nor the accompanying images show.  If you look at the images shown on this post (which are the images in the press release) carefully, Japan is in the far upper left corner and the waves that were observed and are modeled are far out away from Japan in the Pacific Ocean. They were observed 7:30 and 8:20 hours AFTER the earthquake.  In contrast, the waves that devastated northern Honshu struck in 20 minutes.

Unfortunately, I am not at AGU to hear the paper (which is not being given until Friday morning), but I find the press release to have very little content--it basically says that two satellites captured the above two images, that there was a "merged tsunami," and that this merging phenomenon may account for unexpected destructive power." And, I find the images to be baffling....what do the three black arrows point to? What is the purple line that runs up through the bottom image, and why is it red in the top image? What is the red arrow on the bottom of each image and why has it changed position? What am I supposed to be seeing in these images?  The abstract of the actual paper (by Y. Tony Song and others) has a different figure). For info, I have attached the actual abstract at the bottom of this post.

Here's what I do see--in both images the red areas show water that is higher than an arbitrary zero-level (see the scale on the left image). The blue areas, in contrast, represent water that is below the zero level.  These two areas correspond to the highest and lowest peaks in the model and data shown on the right side of the figure. All that I can pull out of the two images on the left side is that there isn't as much red or as much blue in the bottom image as in the top one--that is, the high water is less high, and the low water is less deep, which is what you expect as a tsunami spreads out to cover more and more area. My concept of a "merged tsunami" is that two high waves catch up with each other producing a bigger wave by constructive interference.  I can't see that in these images.

Readers--HELP!! (And they did, see reader comments!)

And, JPL--shame on you for an ambiguous, if not downright misleading, headline. It did its job in attracting a lot of attention, but it created a lot of misinformation, and that's not the job of a scientific press release.
______________________________________________________________________________________
ABSTRACT FINAL ID: NH51C-02;
TITLE: Merging Tsunamis of the 2011 Tohoku-Oki Earthquake Observed from Space (Invited)
SESSION TYPE: Oral
SESSION TITLE: NH51C. Remote Sensing of Natural Hazards I
AUTHORS (FIRST NAME, LAST NAME): Y Tony Song1, Ichiro Fukumori1, Yuchan Yi2, C. K. Shum2
INSTITUTIONS (ALL): 1. CALTECH/MS 300-323, Jet Propulsion Laboratory, Pasadena, CA, United States.
2. Ohio State University, Columbia, OH, United States. 
Title of Team:
ABSTRACT BODY: Tsunamis often severely devastate some coastal areas while leaving others with little damage. This unpredictable situation has been a major challenge for accurate and timely tsunami forecasting for evacuating coastal communities. Here we show evidence from satellite observations of the 2011 Tohoku-Oki earthquake-induced tsunami that sheds light on this issue. Three satellites observed the same tsunami front, and for the first time, one of them recorded a tsunami height about twice as high as that of the other two. Model simulations confirm that the amplified tsunami is one of several jets formed through topographic refraction when tsunamis travel across ocean ridges and seamount chains. This process causes the tsunami front to merge as it propagates, resulting in doubling its wave height and destructive potential in certain directions before reaching shore. We conclude that the potential of tsunami merging jets should be taken into consideration for designing coastal tsunami hazard maps and assessing risk levels at coastal oil refineries and nuclear power facilities.
http://science.jpl.nasa.gov/people/Song/
KEYWORDS: [0933] EXPLORATION GEOPHYSICS / Remote sensing, [4564] OCEANOGRAPHY: PHYSICAL / Tsunamis and storm surges, [7215] SEISMOLOGY / Earthquake source observations.
(No Table Selected)
SPONSOR NAME: Y Tony Song

Additional Details
Previously Presented Material:

Contact Details
CONTACT (NAME ONLY): Y Tony Song
CONTACT (E-MAIL ONLY): yuhe.t.song@jpl.nasa.gov


Thursday, December 1, 2011

Santa Ana winds pummel southern California; Pasadena declares state of emergency

Tree attacks gas station in Pasadena, California
This does bring back memories--I lived only a few blocks from
here when I was a grad student at Caltech!
Photo by KTLA published in the Los Angeles Times
Updated: 9:20 a.m. CST Thursday 12/01.
Updated: 7:15 p.m. CST, Thursday 12/01.

Wind gusts up to 97 miles per hour are pummeling southern California, causing fires, downing electrical wires, and toppling trees. (Update: Winds up to 140 miles per hour have been recorded at the crest of the Sierras). According to the LATimes, firefighters were being dispatched every 12 seconds in response to emergency calls on downed electrical lines. As of this morning, over 25,000 people are without power, and the winds are expected to continue through Thursday. LA airport was having problems with debris on the runways, but flights are being allowed to land. Update: Pasadena has reported up to 200,000 people without power, and has closed schools and libraries until further notice.

Raymond Chandler described these winds in his 1938 novel, "Red Wind": 
"There was a desert wind blowing that night. It was one of those hot dry Santa Anas that come down through the mountain passes and curl your hair and makes your nerves jump and your skin itch. On nights like that every booze party ends in a fight. Meek little wives feel the edge of the carving knife and study their husbands' necks. Anything can happen. You can get a full glass of beer at a cocktail lounge."

Santa Ana winds are one type of wind called "katabatic" winds. Katabatic is derived from the Greek word "katabatikos" meaning "going downhill." They occur in numerous places around the world.  In southern California they form when air flows from the Great Basin of Nevada westward to the Pacific Coast. As the air flows downhill, it compresses and becomes denser. This compression causes the air to warm and in the summer the winds feel like a blast from a furnace. In the winter, however, this process isn't strong enough to overcome the fact that the air is very cold when it starts from the Great Basin and the winds can bring some of the coldest weather of the season into LA.  The temperatures were down in the forties last night.

Although there was only one fire yesterday and it was quickly controlled, Santa Anas in the autumn can be extremely dangerous--the humidity is low, abundant summer vegetation dries out, and the winds can fan huge fires if they get out of control. The LA fire department has boosted its staffing and declared a "red flag warning" of high fire danger. The Santa Anas are also dangerous to peoples health because they can carry a pathogenic fungus spore that causes Valley Fever (Coccidioidomycosis), an influenza like condition.

Update: More meteorology: There is a counter-clockwise low-pressure system parked over California, and a clockwise high-pressure system over Arizona, Nevada, and the Great Basin. These two systems are funneling the winds into California.  Here's an AccuWeather update. The winds are expected to continue into Friday. Pasadena seems to be the "epicenter" of the storms.

Tuesday, November 29, 2011

Painting a glacier?

The painting team approaching the peak of Chalon Sombero, Peru
From here
Lipaca, Peru, is a village high (5000 meters) in the mountains of Peru being devastated by the demise of nearby glaciers. The people, and their alpacas, have relied on water from glaciers that have now disappeared.  In an experiment, Eduardo Gold, and the foundation "Peru Glaciers" are whitewashing the rocks with a mixture of water, sand and lime to try to change the local albedo and restore the glaciers. The principal is simple: the natural local rocks are black. They absorb sunlight and heat up, a property described by the "albedo." The higher the albedo, the more sunlight absorbed. Gold postulates that by painting the rocks white, the albedo can be reduced. Less sunlight is absorbed, the rocks are cooler, and the glaciers may return.  Using a hand-held measure of albedo, he shows a difference of temperature of the rocks of 30 F between black and white rocks. Then, as seeming proof of this concept, grabs a handful of ice out of the cracks between the rocks, and it does appear that water is flowing where, according to the local people, it hasn't flowed for awhile.

The rocks are painted by an amazing effort of throwing whitewash on rocks one bucket at a time--a hardy people carrying one bucket at a time over rock by rock on this mountainous terrain!  So far, 15,000 square meters have been covered with whitewash. Sounds impressive? It is, when viewed by rock by rock, but it's only three times the area of a football field.  Gold estimates that it will take three BILLION square meters, or 500,000 football fields, to restore a glacier here. the cost would be 1.5 billion over 5 years, a huge sum for a small village in Peru. The UN has given him a startup grant to pursue the project.

But, carrying this further--I never doubt the ingenuity of the human brain. Given proposals to load the atmosphere with sulfur dioxide to create a yellow haze to reflect sunlight, isn't it logical to think that someone will propose that if six billion people were throw just a few buckets each of whitewash on our fields, farms, and mountains we could cool the globe??  .....definitely need to think about this...

Monday, November 21, 2011

9,627 feet and counting--Shell sets new deep water drilling record.

Shell Oil has posted this graphic of the Perdido well compared to other
wells in the Gulf of Mexico. Note the progression from shallow to deep over
the past 30 years.
According to the Houston Chronicle, Shell Oil Company has announced that it is producing oil from a well 9,627 feet below the surface, drilling through 8,000 feet of water and another 1,627 feet of sediment and rock. This depth is more than six times the height of the Empire State Building.  The record broke the old record by 271 feet. BP and Chevron also have investment shares in this well (37.5% and 27.5% respectively). The well is 200 miles out in the Gulf from Houston. It serves three fields: Great White, Tobago, and Silvertip). At peak production, it can produce 100 kboe/d, which I assume means 100,000 barrels of oil equivalent per day. The Tobago field, where the record was broken, is the world's deepest subsea completion.

A major part of the Perdido "spar" was constructed in Finland, and it took an 8,200 mile journey to Texas over a three month period in 2008. The spar is 555 feet long, attached to the sea floor.  The drilling and production platform was constructed on top of the spar.  About 270 people live on the platform and an "adjacent floating hotel (a flotel)." There are 22 vertical access wells from the spar.

Equally impressive is that the well is several miles away from the Perdido drilling and production that serves it, and other wells that are up to seven miles away.  The oil has to flow along an incline on the sea floor before being pumped vertically to the platform. Shell says that the reservoir is a low-ressure reservoir which, I assume, means that it's mostly oil and not gas. The low pressure made it necessary for engineers to install a system of electrical pumps in the seabed to help get the oil to the surface, a technology that didn't exist when Shell purchased the lease in 1996.

A bit of an alarm bell went off when I got to the end of the article.  According to Don Van Nieuwenhuise of the University of Houston, producing from this depth is pushing up against the limits of safety equipment which is designed, only recently, to be used in up to 10,000 feet of water.  Well control equipment has been designed or redesigned for this limit in the aftermath of the Deepwater Horizon accident last year.  Ven Nieuwenhuise says "They are getting real close to the limit of what we can do safely." To which, the shell spokesman, Jaryl Strong, replies "There are a number of safety innovations built into the Perdido platform to accomodate the environment it is in, in terms of the great depths and long distance from shore. Safety was the No. 1 priority."

Thursday, November 17, 2011

The Art of Science

"Two fish swimming side-by-side"
Photo by Brigitt Bosehitsch, Peter Dewey
and Alexander Smits
Today the New York Times posted a beautiful collection of pictures in which images from science and technology are presented artistically. These are from the Princeton University Art of Science Competition. My favorite is #10 shown on the left, "Two Fish Swimming Side-by-Side," which shows vortices spinning off of two fins (bottom of the photo) flapping in-phase. Water loaded with hydrogen nanobubbles is flowing from the bottom to the top past the fins. The stripes of bubble-containing and bubble-free water shows how the vortices are created and propagate away from the fins.

NASA Terra MODIS image
Vortex streets are common in the oceans and atmosphere. Here's a Terra MODIS image of one formed when the clouds over the ocean are disturbed by an obstacle, in this case Madeira Island.  A second interesting feature in this photo is the pattern of the clouds in general. There are roughly hexagonal cells of air. These form when the air is heated at the base (or cooled at the top). Warm air rises in the centers and sinks around the edges. This pattern frequently arises when you heat a pot of water on the stove, and is called Rayleigh-Bernard convection.

Thursday, November 10, 2011

New Madrid Fault: To Break or Not to Break?

Geophysicist Seth Stein, described in the Nature
article as "a hyper-intelligent version of George Costanza,
the ever-complaining character from the television show
Seinfeld..." 

With a title reminiscent of a best selling science book "How I killed Pluto, and Why it Deserved it," Nature today has featured "Seth Stein: The quake killer." In spite of the impression you might get from the article and from this picture, Seth does have a great sense of humor! 

The quake that he's killed is the feared future quake on the Reelfoot fault in the New Madrid region of the 1811-1812 earthquakes.  Seth adamantly opposes the established position of the U.S. Geological Survey (USGS) which puts the probability of a large earthquake there as high as the regions along the West Coast and Alaska. The article, by Richard Monastersky, in this week's Nature, is long and well done (thank the world for great science writers!). Stein makes several arguments, the strongest being that surveys across this region with Global Positioning System (GPS) instruments show no evidence that strain is accumulating in advance of future quakes. Stein has been monitoring the region for the past 20 years. Another argument that he makes is that there is no topography to speak of in the region, topography that would be expected if there was a long history of faulting. 

USGS earthquake hazard map
For a long time the earthquakes that occurred here in 1811-1812 have been assigned a magnitude between 7.8 and 8.4, which would make them bigger than any earthquakes in the history of the mainland U.S. (Alaska has had a bigger quake). However recent work not only by Stein, but by USGS and other geologists as well, now have downgraded these to a magnitude between 6.8 and 7.0, a factor of twenty five times less energetic.

The faults in this area are hundreds of millions of years old. But what reactivated those faults and triggered those quakes. Stein's idea, with Roy van Arsdale, is that they are responses to the unloading of about 12 meters of sediment by erosion from the Mississippi River during the 16,000-18,000 years since the end of the last ice age. Reduction of pressure by removal of that weight altered the stresses along the old faults enough to reactivate those faults in the region that are ready to go. However, once a fault breaks, there is not enough stress in the region to trigger another big quake along it. The seismic activity would end on this fault, but other faults in the area could still be under stress. A bottom line is that the big picture should focus on a broad area of faults, not simply on the New Madrid area itself.

The implications are not trivial.  Reinforcement of old buildings in this part of the country is an expensive proposition, and whether you have to reinforce for a magnitude 6.8 or magnitude 8.4 earthquake makes a huge difference in the cost.

Stein has written a trade-science book "Disaster Deferred: How New Science is Changing our view of Earthquake Hazards in the Midwest." It's a great read!

Tuesday, November 8, 2011

Asteroid 2005 YU55 is NOT Armageddon!

Radar image of 2005 YU55 in April 2010
NASA
Armageddon was a 1998 thriller movie based on a Texas-sized asteroid heading toward the earth, which would then be saved by Holllywood heros sent to nuke the rock (which would simply create a lot of smaller destructive asteroids still headed toward us! Asteroid 2005 YU55 is not as big as Texas, only the size of an aircraft carrier (400 m diameter), and it's heading for closest approach tonight (Tuesday, November 8th at 23:28 UT (5:28 CDT). It will come inside the orbit of the Moon, about 85% of the distance between the Earth and Moon. The asteroid was discovered at the University of Arizona's Lunar and Planetary Laboratory on December 28, 2005. Objects this size come by about every 30 years.

According to Jay Melosh at Purdue, the asteroid would create a crater 6.3 km across, 518 m deep, and deposit the energy equivalent to a magnitude 7 eartquake. YU will pass close to Venus in 2029 and the exact details of that encounter will determine how close to the earth it will come in 2041.

JPL has a small-body database browser here that allows you to visualize the orbit, but the site is, at this time a few hours before the encounter, overloaded. We're not going to see it in gray, rainy Urbana tonight, but amateur observers in Europe and on the East Coast have a great chance. This is the first near asteroid for which observers have had advance warning and been gearing up to make radar, visual and infrared observations. With 5-meter radar observation, they are hoping to create a detailed 3-D image of its shape and surface.

I'll update the photos as they are released after the encounter.

Monday, November 7, 2011

North Korea's Mountain of Doom! Volcanoes and international science

View into the crater of Mount Paektu, a ka Changbai,
from the North Korean side. The staircase is several hundred
meters long, descending to a unique research base.
Photo by R. Stone/Science magazine
Rarely does an article in the staid peer review journal, Science, cause me to gasp! But a "NewsFocus" article*** in this week's issue by Richard Stone is so well written and informative, and the many themes woven through it are so impressive, that it did make me gasp!  It appeared this week--an intriguing description of an international collaboration working to determine the eruption potential, and schedule, for Mount Paektu, North Korea. North Korea and active volcanoes? China and active volcanoes? A shared active volcano on their border? A volcano that has at least two names and challenged the prestigious journal to figure out whether to call it by its Chinese name or its North Korean name? (The volcano ruled--two thirds of it is in China, so it's referred to in this article by its Chinese name, Changbai.)

From a combination of historical records and ash layers, it appears that Changbai wakes up every 100 years or so, the last time in 1903. Rather alarmingly, about 1000 years ago, the volcano had an eruption that was one of the largest of the past few thousand years, rivaling the 1815 eruption of Tambora in Indonesia. It spread ash over 33,000 square kilometers of northeast China and Korea, and dumped 5 centimeters of ash on Japan. (So that this post is not taken as being alarmist, there is no indication that an eruption is imminent.) I'm not going to dwell on the volcanology here, perhaps at a later date. In a nutshell, on a Volcanic Explosivity Index (VEI) of 8, only a few 7's have occurred in the last 11,500 years, and the eruption of Changbai 1000 years ago was one of them. It erupted nearly 100 cubic kilometers of ash.

I think that the importance of this Science article is the spotlight that it shines on science as a way to transcend political and philosophical borders.  The North Koreans and Chinese have already established a collaboration to monitor this dangerous volcano, and in September, they brought in two westerner geologists from the U.K. to visit the site. They are James Hammond from Imperial College, and Clive Oppenheimer from Cambridge. They were accompanied by Richard Stone, the author of the article. This "unprecedented encounter was facilitated by two nongovernmental organizations: Pyongyang International Information Center on New Technology and Economy, or PIINTEC, based in Pyongyang, and the Environmental Education Media Project in Beijing." The three were impressed with the North Korean scientists and facilities, and with the budding collegiality--  Chinese scientists may be doing research at Paektu in North Vietnam next summer. The deputy director general of DPRK's Earthquake Administration has said "we welcome scientists with open arms" (to build up the capability to monitor the volcano and forecast eruption scenarios." Hats off to all who made this work, including Hans-Ulrich Schmincke who managed to get in there in 1993!

Over the past centuries, there have been only a few ways to transcend the political and military tensions that are all to prevalent and dangerous in the world. They have been (1) arts and culture; (2) humanitarian aid; and (3) science, particularly in the area of natural hazards.  For another program, very relevant to "Mount Doom", take a look at Cities on Volcanoes, a Commission of the International Association of Volcanology and Chemistry of the Earth's Interior (IAVCEI).

***Vigil at North Korea's Mount Doom, by Richard Stone, Science, 334, November 4, 2011, pp. 584-588.

Sunday, November 6, 2011

Earthquake in Oklahoma!

Seismogram posted this morning by
the Oklahoma State Geological Survey
Late Saturday night, the biggest earthquake in history, magnitude 5.6, hit Oklahoma  about half way between Oklahoma City and Tulsa. It was preceded by a 4.8 earthquake that morning, itself the third-strongest in Oklahoma history. The big earthquake was about the same size as the one that hit the east coast in August.They were a few miles apart and neither caused injuries or death, although some damage is being reported--buckling of roadways, damaged chimneys, interior damage to houses. The quake was felt in nine states. There have been more than seventy aftershocks as of early Sunday morning. The epicenter was four miles east of Sparks. The morning earthquake was shallow, 3.1 kilometers, and the evening earthquake deeper at 5 kilometers.  Both quakes were very near a place where a magnitude 4.3 earthquake occurred on February 27, 2010. They are on the Wilzetta fault, which is also called the Seminole uplift.


The first reported earthquake in Oklahoma occurred in September 1918, according to a USGS summary of earthquake history in the state, and earthquakes have not been uncommon in the state. Earthquakes have increased in frequency from about 2009 to the present and there is speculation, though no agreement, on the cause of this increase. The Seminole Uplift is a broad subsurface feature about 50 miles wide and over 75 miles long. It consists of a number of anticlines and "faulted noses" (oil company jargon) that host oil, and the uplift has been a prolific oil source. Many of the wells drilled in the 1920's to 1940's are still producing today and it is likely that there will continue to be speculation on the role of drilling and oil production in causing shallow earthquakes such as those that occurred this weekend.

Here's a nice article on the history of oil production in Oklahoma. The geology librarian, Lura Joseph, at the University of Illinois has created a resource of earthquake and tsunami information here.

Many of us can't hear the word "Oklahoma" without hearing it as "Oooooooooo-klahoma..." from the great musical by Richard Rogers and Oscar Hammerstein, set outside the town of Claremore in 1906, one year before Oklahoma was granted statehood.  The discovery of abundant oil there in 1889 and successive years contributed significantly to the granting of statehood. It's a great fun musical in case you haven't seen it!

Oklahoma

They couldn't pick a better time to start in life
It ain't too early and it ain't too late
Starting as a farmer with a brand new wife
Soon be living in a brand new state
Brand new state, gonna treat you great!

Gonna give you barley, carrots and pertaters
Pasture fer the cattle, spinach and termayters
Flowers on the prarie where the June bugs zoom
Plen'y of air and plen'y of room
Plen'y of room to swing a rope
Plen'y of heart and plen'y of hope

Oklahoma!
Where the wind comes sweeping down the plain
Where the waving wheat
Can sure smell sweet
When the wind comes right behind the rain

Oklahoma!
Every night my honey-lamb and I
Sit alone and talk
And watch a hawk
Making lazy circles in the sky

We know we belong to the land
And the land we belong to is grand
And when we say Yeeow!
Ayipioeeay! Yeeow!
We're only saying "You're doin' fine Oklahoma"
Oklahoma O-K

O-K-L-A-H-O-M-A
Oklahoma!

Saturday, November 5, 2011

The birth of a big iceberg, Antarctica

Rift developing across the pine Island Glacier
From bbc.co.uk
About every ten years the Pine Island Glacier (PIG) on the West Antarctica coast sheds a giant iceberg. The last event was in 2001, and so it's time. Sure enough, "right on schedule" a 30 km long crack is developing across the tongue of the glacier, and a 880 sq. kilometer (300 sq. mile) iceberg is expected to break loose within a few months.  Although scientists are not attributing this to climate change because of the history of such events, there has been a significant thinning of the PIG, which may be.  It is about 60-100 m down to the water surface, but the crack may extend underwater to a depth of 500 m.

Typically glaciers like this end in ice shelves that are grounded against the sea floor near the coast.  However warm seawater has been eating away at the underside of the PIG shelf, so that it has been floating free. This allows a feedback in which more and more melting occurs.  A floating ice shelf is much more vulnerable to breaking off than a grounded one.

The Pine Island glacier is a major outlet for the West Antarctic Ice Sheet, and a potential significant contributor to long-term sea-level rise. It drains about 10% of the West Antarctic Ice Sheet. It is a fast-moving glacier, and its motion has been accelerating recently. Between 1974 and 2007 the speed increased by 73%. By the end of 2007, the PIG had a negative mass balance of 46 gigatonnes per year (that is, more water was going into the sea than was being replaced by snow), which would translate to 0.13 mm global sea level rise per year.  Once this piece breaks off, the snout of the PIG will be the furthest back since monitoring of it started in the 1940's. It will be interesting for scientists to monitor it for the next decade to see if it follows its old pattern of growing back out, or stalls.

Tuesday, November 1, 2011

The "seven billionth baby" and Bangkok flooding

Bangkok flooding about 1900
LL/Roger Viollet as published in the Wall Street Journal
The impact of natural disasters is changing as more and more people are crowding onto the planet. Fittingly, yesterday was the day that the United Nations has projected that the seven billionth baby will be born somewhere on the planet. Four babies are born about every second.  The soaring population means that more and more people are crowding into livable spaces, and particularly into big cities as they seek work. Bangkok is no exception.

It has a long history of flooding. In 1785 there was a flood of nearly 15' height, and one of 10' height in 1819. In 1917 all roads were underwater for a month and in 1942 a 5' high flood stayed for two months. The current flood is the biggest since the 1942 flood, although there have been significant floods in 1975, 1980, 1982, 1983, 1995, and 1996. Over the centuries, the city had developed a large system of canals to drain the water to the ocean, but as industrialization and modernization many of these canals, including the one in the picture, were paved over to make streets and living and factory space.

Bangkok is sinking at a rate that may bring it to sea level within decades, possibly as early as 2030. However, there is one major difference between Bangkok and cities like Venice or Amsterdam that are at or below sea level. These last two cities average about 32" of rain per year, Bangkok receives nearly double that rain, 57". This year there has already been 86". These rains are from the rainy season monsoon. The economic impacts of the floods this year are serious. One third of the country is flooded, 10% of the rice crop is gone, damage already exceeds $4 billion, and economic growth for next year will be reduced by 1-2%.  There are political implications as well--the Prime Minister,  Yingluck Shinawatra is new and inexperienced, having only taken office in July.  Although the normally politically polarized Thai's have unified remarkably under the stress of the floods, the opposition, which has close ties to the military, is calling for a state of emergency to be declared and for the military to take control. The Thai military is "not inexperienced" at launching coups d'etat. We are watching an intricate unfolding of natural hazards, economic and political interplays.

Thursday, October 27, 2011

Salmon win! A 12 story dam removed on the White Salmon River

Condit Dam seconds after a blast has opened
a gaping hole at the base on 10/26/11.
PacifiCorp via AP photo from here.
The 125' tall Condit Dam was installed across the White Salmon River in 1913, a 12-story high dam that prevented salmon from migrating back to their habitat and closed fisheries to the Yakama Nation for nearly 100 years. Yesterday part of the dam was removed by blasting.  Here's a beautiful video prepared by Stella and Emily Washines, with beadwork telling part of the story.

The Condit Dam is the second-tallest dam to be demolished in U.S. history, and it provided power for about 7,000 homes but the owner, PacificCorp elected to remove it rather than install expensive fish passage structures that would have been required for relicensing. The dam removal project will cost about $32 million when restoration of the valley is completed--and restoration will be needed as you'll see from the video below.

Prior to the blasting, work crews created an 18 foot wide, 13 foot tall tunnel in the base of the dam. A layer of silt about 50 feet high had accumulated in the lake, Northwestern Lake, behind the dam.

Here's a video of the actual event. Nothing happens for a minute (so you can keep reading this while you are waiting, but it's worth the wait!) Watch at the very base of the dam at about 1 minute 17 seconds into the film-- you can see a small atmospheric shock wave and steam cloud formed by the explosion that triggers a massively high-pressured jet. By breaching the dam at the bottom, sediment is removed from the base of the reservoir and yet the dam remains to be removed by heavy machinery at a later time.   It may be my imagination but at about 1'27" it looks like branches in front of the camera start moving because of wind generated by the atmospheric shock and the violent flow.  At about 2:15 there's a nice shot of the jet at the base of the dam with sediment coming out on the bottom and clear water on the top, a stratified flow.

(There are 3.3 miles of the white Salmon below the dam---No need to feel sorry for any luckless salmon that happened to be trying to return to spawn on this day....Fisheries biologists captured and relocated 679 tule chinook from below the dam to protect their spawning nests from the sediment removed from the reservoir. )

Removal of the dam will open 33 miles of habitat for steelhead after the restoration, and restore the White Salmon River for white-water rafting. Other dams in the process of removal and restoration are the 210-foot Glines Canyon Dam and the 108 foot Elwha Dam, both on the Olympic Peninsula.

Wednesday, October 26, 2011

Major flooding in Bangkok

NASA MODIS image from Terra satellite, October 25, 2011
Bangkok, Thailand, is experiencing extreme flooding. To our friends there, stay dry and stay safe! We're thinking of you!

The flooding has been building for three months. The flood waters are expected to rise to as much as 5', and the highest tide of the year is to come this weekend, backing up the rivers.  The average elevation of bangkok is less than 6'. The Thai prime minister has declared a five-day public holiday in affected areas (21 provinces including Bangkok) in an attempt to get people to seek safety away from the city.  The Chao Phraya River which winds through the capital is likely to top its embankments this weekend.  The domestic airport, Don Muang airport, is closed because floodwaters flowed onto the runways and affected lighting. Domestic flights are being rerouted to Suvarnabhumi Airport.  The floods have killed 373 people and affect 9.5 million. This is the worst flooding in a half century and may continue for a month as the water drains out through the cities 1,682 canals to the rivers.

NASA MODIS image, November 13, 2008
In some places, the water approaching the city is 10' deep. It may have inundated 10,000 factories north of the city, disrupting supply chains for Apple and Toyota. Thailand makes about 1/4 of the world's hard disk drives and is a production hub for Japanese carmakers and electronics firms. The dikes holding back the floods have not been tested by floods of this size and so it's uncertain whether they can withstand the pressure of 10' deep water. An advisor from the Netherlands has said "Any dike system that comes under extreme conditions will show failures."

It is estimated that the flooding will cut about 1 percentage point from economic growth, and the budget for rehabilitation may exceed $3.2 billion.

The summer monsoon (August to October) is the culprit here.  Here's a site that gives a good overview of the monsoon meteorology in Thailand.

Tuesday, October 25, 2011

Fantastic Northern Lights! A rare red aurora last night.

The aurora in Arkansas, USA
Photo copyrighted by Brian Emfinger
Permission to use has been granted.
Last night we were out running errands around 6:15 and I commented to my husband that the sunset looked unusual. It was a brilliant orange in the west, but only over a fairly small area, didn't seem big enough to light up the whole sky. But, in the east, the clouds were an unusual pink color. Unfortunately, though I had my camera in the car, I didn't take a shot because there wasn't a "perfect" setting (the Champaign airport is not the prettiest foreground for such a shot), and so other than my comment, I have no record of this event that turns out to probably have been the first aurora that I've seen!

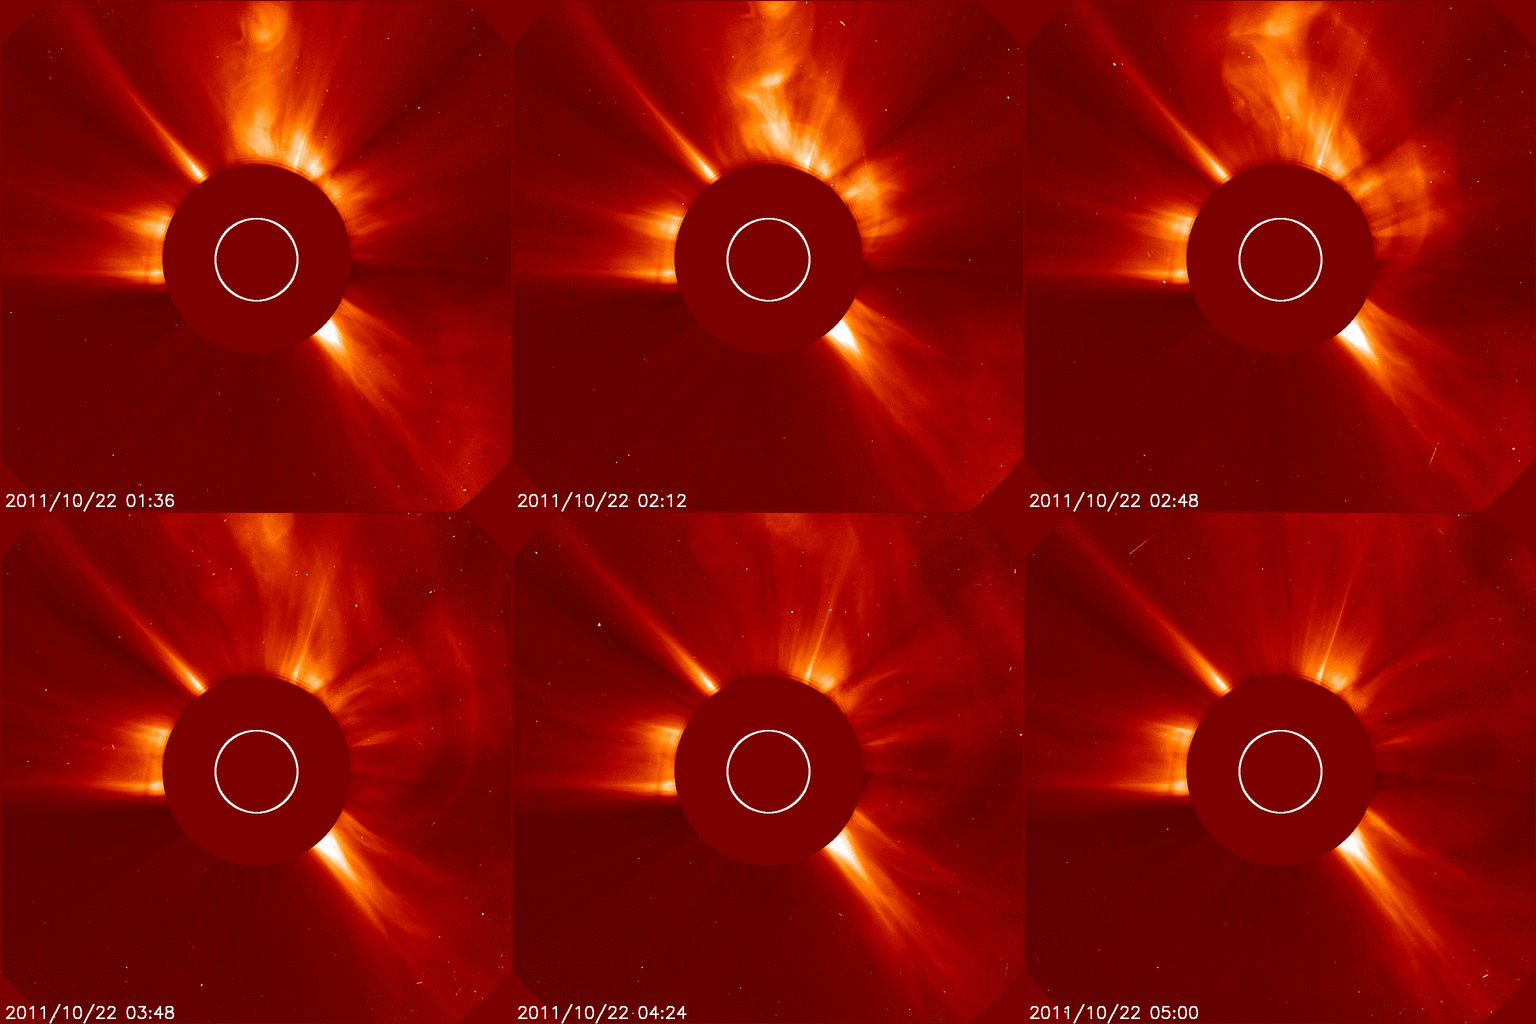
I was therefore surprised to get up this morning and read about the magnificent aurora that filled the sky around that time! The aurora was caused by a coronal mass ejection (CME) two days earlier. It can be viewed here http://www.spaceweather.com/images2011/22oct11/cme_c2_strip.gif.

More discussion about this event can be found on spaceweather.com, which also has a great collection of pictures from places as far south as New Mexico.  The aurora was one of the fairly rare "red" ones.

Auroras are produced when electrons and protons from a CME interacts with the earth's magnetic field, generating electrical power. The discharge can be though of as a great big neon sign in the sky.  Gases give off photons, light, when subjected to an electric field. Green auroras with a reddish lower border are fairly common, and originate at an altitude of about 60 miles above the earth. Red auroras are much rarer, and occur much higher in the atmosphere, 180 to 300 miles.  They are associated with a large influx of electrons that move too slowly to penetrate deep into the atmosphere. At this altitude, the electrons lose their energy to oxygen atoms. The light produced is at a wavelength of 6300 and 6364 Angstroms on the spectrum, a true red color. Details of the process are still a mystery.

Here's a post that I did a year ago on solar flares and Newt Gingrich.

Monday, October 24, 2011

The Chicxulub impact--What happened on the opposite side of the earth?

Artist impression of Chicxulub impact.
Artist unknown.
A number of researchers have asked "what happened on the side of the earth opposite the place where the meteorite hit in the Yucatan (Mexico) 65 million years ago?" This point is called the "antipode." The earth is a sphere, and acts like a lens to focus seismic waves on the opposite side of the planet. Body waves travel through the interior and are focused by reflection and refraction off of boundaries such as the crust-mantle, mantle-outer core, etc. Surface waves converge at the antipode after spreading out from the impact site, which looks like a point source of energy at the scale of the whole earth. Models to date have used  a spherically symmetric earth and did not include subtlties such as the elliptical shape of the earth or continents. These models have suggested that there could have been at least 10 meters (33 feet) of shattered uplifted rocks at the antipode.

 In a new paper in the October 2011 issue of Geophysical Journal International, Meschede et al. have combined a detailed 3-D model of the earth's interior and crustal structure with numerical calculations of the propagation of seismic waves around the earth after an impact.*** They model the impact as a single-force point source from the impact of a stony meteorite 20 km in diameter impacting at 20 km/sec.  They use a Gaussian source-time function to model the duration of the event, and assume that 0.001 to 0.0001 of the meteorite's energy ends up in the seismic waves that propagate away from the point of impact. In their model, the earth has a solid inner core, fluid outer core, ellipticity, topography and bathymetry, oceans, and rotation. The average node spacing is 10 km (this must have been done on a humongous computer!).  Since the continents were in different positions 65 million years ago, they chose an impact position to mimic it's position relative to the Eurasian and American continents at that time. The ancient antipode position was north of Australia. 
They found that it takes about 1.5 hours for the waves to reach the antipode.  The maximum displacement was calculated to be 4 meters, less than half that of the older models.  The structure of the displacement field is not symmetric, but has a starfish rayed shape because of heterogeneities in the crust, such as the thick seismically slow crust of the Andes.  In vertical cross section down to the base of the mantle, there are "chimneys" of peak stress, regions where stresses are concentrated.

A number of researchers have asked "what happened on the side of the earth opposite the place where the meteorite hit in the Yucatan (Mexico) 65 million years ago?" This point is called the "antipode." The earth is a sphere, and acts like a lens to focus seismic waves on the opposite side of the planet. Body waves travel through the interior and are focused by reflection and refraction off of boundaries such as the crust-mantle, mantle-outer core, etc. Surface waves converge at the antipode after spreading out from the impact site, which looks like a point source of energy at the scale of the whole earth. Models to date have used  a spherically symmetric earth and did not include subtlties such as the elliptical shape of the earth or continents. These models have suggested that there could have been at least 10 meters (33 feet) of shattered uplifted rocks at the antipode.

Peak displacements in the impact hemisphere (left) and the antipode (right).
 In a new paper in the October 2011 issue of Geophysical Journal International, Meschede et al. have combined a detailed 3-D model of the earth's interior and crustal structure with numerical calculations of the propagation of seismic waves around the earth after an impact.*** They model the impact as a single-force point source from the impact of a stony meteorite 20 km in diameter impacting at 20 km/sec.  They use a Gaussian source-time function to model the duration of the event, and assume that 0.001 to 0.0001 of the meteorite's energy ends up in the seismic waves that propagate away from the point of impact. In their model, the earth has a solid inner core, fluid outer core, ellipticity, topography and bathymetry, oceans, and rotation. The average node spacing is 10 km (this must have been done on a humongous computer!).  Since the continents were in different positions 65 million years ago, they chose an impact position to mimic it's position relative to the Eurasian and American continents at that time. The ancient antipode position was north of Australia. 
They found that it takes about 1.5 hours for the waves to reach the antipode.  The maximum displacement was calculated to be 4 meters, less than half that of the older models.  The structure of the displacement field is not symmetric, but has a starfish rayed shape because of heterogeneities in the crust, such as the thick seismically slow crust of the Andes.  In vertical cross section down to the base of the mantle, there are "chimneys" of peak stress, regions where stresses are concentrated.

The calculated stresses from the impact are comparable to stress drops observed in moderate to large earthquakes, prompting the authors to speculate that there could have been earthquakes in response to the seismic waves propagating away from the impact.

The calculated stresses from the impact are comparable to stress drops observed in moderate to large earthquakes, prompting the authors to speculate that there could have been earthquakes in response to the seismic waves propagating away from the impact. They say that the stresses are probably large enough to trigger volcanism, and that the seismic waves are large enough over areas of the ocean to induce tsunamis.


***Meschede, M.A., Myhrvold, C.L., and Tromp, J., Antipodal focusing of seismic waves due to large meteorite impacts on Earth, Geophysical Journal International, 187, 529-537, 2011.

Thursday, October 20, 2011

"Flash heating" as a mechanism for fault weakening during earthquakes

The San Andreas fault
USGS photo
One problem that has mystified seismologists and geophysicists for a long time is the lack of high heat flow over active fault zones. When rocks are stressed in laboratory experiments, data indicate that faults should be very strong, and theories suggest that when they fail during an earthquake, frictional heating should create high temperatures. But, that is not observed on faults like the San Andreas in California.  A variety of laboratory experiments over the past decades have suggested that rocks are actually very weak under conditions of fast sliding that are occur in earthquakes.

In a paper*** in this weeks Science, Goldsby and Tullis point out that when two rock surfaces are brought together, they only touch at a few small contact points compared to the total surface area. These points have average sizes of tens of microns. Like the floor under a spiky woman's high heeled shoe, the stresses are concentrated on these points, typically having local stresses of 10 GPa for even modest average stresses. When these microscopic contacts are sheared in an earthquake, very high temperatures can result.  If the shearing rate is slow, heat can diffuse away from these points and the temperature remains low. However, if the shearing rate is high, there is no time for diffusion and the temperature at the points increases, sometimes to melting temperatures.

The results are based on laboratory experiments on a number of different rock types.  In these experiments rocks were sheared past each other at velocities up to 0.4 m/s over distances up to 45 mm. The results showed that the friction coefficient decreased dramatically when sliding velocity exceeded about 0.1 meters per second. Visual inspection of the samples after the sliding experiment showed that a thin layer of gouge (melted rock and crushed rock) had formed. The gouge layer was less than 30 microns thick.

The authors propose that flash heating is the dominant mechanism of weakening in small-slip, small-magnitude earthquakes, and that it is likely to be the dominant mechanism determining the strength of a fault in the early stages of larger earthquakes.  During continued slip during large earthquakes other fault-weakening mechanisms may combine with or dominate over flash heating, such as melt lubrication, gel formation, or pore-fluid pressurization.


***Goldsby, D.L., and Tullis, T.E., Flash heating leads to low frictional strength of crustal rocks at earthquake slip rates, Science, 334, 216-218, 2011.

Tuesday, October 18, 2011

Monster haboob in Texas--be glad you weren't flying into Lubbock!

October 17, 2011 haboob in Lubbock, Texas
from http://www.youtube.com/watch?v=wfuDFEZYHTE,
as printed in the Washington Post
A haboob is a giant plume of dust that can extend thousands of feet into the atmosphere. They are common in desert environments, and with the drought in Texas this year there's lots of dust to blow around.  A cold front went through the Texas panhandle yesterday with wind over 60 miles per hour. They often form from downdrafts of approaching thunderstorms, but in this case the winds of the cold front alone were sufficient to kick up the storm.  Cars were forced to stop on highways, and FAA controllers at Lubbock International Airport had to evacuate. Haboobs can be 100 km wide, and they can travel up to 100 km/hour (60 mph). If there is rain mixed into them, they become mud storms.

Probably the best video I've ever found on haboobs is this one from the July 5th, 2011, haboob in Phoenix. This Phoenix haboob was produced by downdrafts associated with a monsoon thunderstorm. As with Texas, Phoenix has been in a drought and so there was enough dust to make the haboob exceptionally intense.

Haboob is an Arabic word for "strong wind."

Wednesday, October 5, 2011

Firefighters nightmare: backdraft explosion

A backdraft explosion from The Gray Monk
Today's CNN news reports on a backdraft explosion at a fire in Ohio. This type of explosion can occur when an oxygen-starved fire suddenly gains access to oxygen, for example when a window breaks or a door is opened. It is a dangerous and well-known phenomenon for firefighters.  An oxygen starved fire produces combustible gases, primarily carbon monoxide, and smoke.  When these gain access to oxygen, combustion can take off again raising the temperature of the gases. Because they heat up, they expand, often extremely rapidly.

As the smoldering fire sucks in oxygen, there is often a "puffing" effect as the fire gets a little, but not enough, oxygen.  As the fire puffs, smoke produced by the fire is often sucked back into the burning area, giving rise to the term "backdraft." Firefighters are taught to avoid these dangerous situations, and to attempt to deal with it by ventilating the fire from the highest point. This allows the heat and smoke produced when the combustion reignites to escape through the highest point without exploding.

Wiki is full of all sorts of interesting trivia! There was a 1991 film "Backdraft" in which a serial arsonist was using backdrafts as a means for assassinating people! Also, if your house burns down and you've got papers stored in a safe--don't rush in to open it!! After the 1906 San Francisco earthquake and fire, business people who opened warm safes to recover their unburned papers exposed the hot gas of the interiors to an oxygen source, immediately and explosively setting the papers on fire!

Thursday, September 29, 2011

Cyclone over Lake Michigan: Flying into O'Hare is always interesting!

Cyclone over Lake Michigan on September 26, 2011
Image from GOES NASA
Last Monday I was returning from the west coast, my flight delayed nearly an hour and a half by "weather in Chicago."  When we finally did depart and get over to the Chicago area four hours later, the landing was a prolonged bumpy ride, as was the puddle jumper down to Urbana. Described by The Capital Weather Gang as a "lumbering, sprawling cyclone," this weather system dominated the mid-West for three days from September 25-27.

This storm is a classic example of the mid-latitude cyclones that dominate the weather in the U.S. Air circulates counterclockwise around a low pressure core (in the Northern Hemisphere). Warm air pushing north and cold air pushing south get wrapped in bands around the center of the cyclone. Air in the low-pressure center rises to form towering clouds, and the comma-shaped tail consists of warm moist air (clouds) and colder dry air (clear areas). In the mid-west, cold air eventually "wins out and wraps completely around a storm," forming a so-called "cold core" storm.  It gets cut off from the jet stream and so, in this case, stalled near Chicago.  The Earth Observatory WWW site which featured this storm has a great animation of the storm from GEOS, here.

These cyclones develop when a trough in the jet stream interacts with a surface frontal zone. The essential low-ressure system forms if there is wind shear (winds increasing with height in the atmosphere) and convection (thermal instability). Three factors lead to formation of the low pressure at the surface: diverging airflow at high altitudes; warm, moist air flowing in at low and mid-levels; and latent heat release.  The storm typically has four stages, all of which can be seen in the video above.  First, a leaf cloud forms on the east side of the trough, a zone of deep and thick clouds. Within the leaf cloud, air is rotating and as the system develops, the clouds develop into a comma shape, which takes on various forms depending on the eastward motion. As the storm develops, the low-pressure circulation gets cut off from the jet stream and without the momentum from the jet stream, the system loses its ability to deepen.  The cold front overtakes the warm front and the system becomes "occluded." After this, the storm weakens as the upper-level winds tear it apart. The comma head may lag behind and continue to rotate, a phenomenon seen on the video above. The discussion and schematics here are very helpful in understanding the process of "cyclogenesis."

Wednesday, September 28, 2011

Terribly Beautiful: The Fluid Mechanics of Industrial Pollution

An open pit pond holding slurry from hydraulic fracturing
Photo by J. Henry Fair
Time Magazine on-line April 20, 2011, had a collection of J. Henry Fair's air photos of industrial pollution. Fair is a photographer whose goal is "to make aesthetically pleasing photographs," to further his mission that "the viewer will come away with an innate understanding of [his or] her complicity [in industrial pollution] and a will to make a difference." The images are published in Fair's first book, "The Day After Tomorrow: Images of Our Earth in Crisis." Fair relies on complementary charter flights from Lighthawk and Southwings, two volunteer-based aviation organizations, to provide his photographic platform in the air.  He's documented the wastes associated with our extraction industries.  The photos in the Time article include bauxite waste from aluminum smelting, tailings from the extraction of oil from tar sands, the oil spreading from the BP Macondo well blowout, and a wastewater pool at a hydrofluoric acid plant, as well as others. All show beautiful fluid dynamics features.

Sunday, September 18, 2011

Melt ponds and meandering streams on an ice island--cool!

Peterman Ice Island, Image from NASA
Astronaut photograph taken on August 29, 2011from the International Space Station
More than a year ago, a chunk of ice five times the size of Manhattan broke off of Greenland's Petermann Glacier (reference for this post is here.) It is smaller now (4 x 3.5 kilometers), having splintered several times in its journey of a few thousand kilometers on the ocean. This piece is referred to as Petermann Ice Island A, fragment 2, and it is currently off the northeast coast of Newfoundland. During August it became stuck for 11 days on a shoal or shallow sea floor. It broke free on August 18, but within a week had split into two large pieces.

The image is NASA's Earth Observatory image of the day today (Sept. 16), and the accompanying description discusses how it is behaving in some ways as if it was still a glacier instead of an iceberg. Specifically, during these warm summer months ice on top melts and water forms streams and ponds as it moves downhill toward the edges of the ice.  Sometimes the water hits a crevass and drains out the bottom of the ice instead of making it all the way to the edge.

The features that caught my eye in this photo above are the incredible meandering streams.More than a year ago, a chunk of ice five times the size of Manhattan broke off of Greenland's Petermann Glacier (reference for this post is here.) It is smaller now (4 x 3.5 kilometers), having splintered several times in its journey of a few thousand kilometers on the ocean. This piece is referred to as Petermann Ice Island A, fragment 2, and it is currently off the northeast coast of Newfoundland. During August it became stuck for 11 days on a shoal or shallow sea floor. It broke free on August 18, but within a week had split into two large pieces.

Back in the 1970's these so-called supraglacial streams were a topic of considerable interest, but it appears that not much has been done recently, and possibly nothing on these streams on ice islands.  Leopold and Wolman observed that they were similar in form to alluvial meandering streams, and noted that since they don't carry sediment, the meanders have a hydrodynamic origin. According to Ferguson (ref below) they form in unfissured hollows that experience appreciable surface ablation and where meltwater from a "sufficiently large" drainage area is concentrated.  It is not clear if they originate on the surface bare ice or not.  Ablation reaches its peak in late spring and early summer when extensive winter snow cover remains. The streams seem to develop at the interface between saturated snowpack and underlying ice, which means that they may already be well established when they become obvious at the surface.  Old channels survive for many years because once cut, the only way that they can be obliterated is by ablation. They erode by frictional melting of the channels, but preferential melting along crystal boundaries may be important, and solar radiation penetrating through flowing water can melt the channel bed as well. Ferguson showed that stream widths are proportional to the square root of the (presumeably peak) discharge (discharge in a glacial environment depends strongly on the time of day.

Parker (1975) studied these and concluded that the instability that triggers the meanders only occurs in supercritical flow, and that the meander pattern does not migrate downstream. He found that the meander wavelength is determined by channel width, depth, and Froude number.


Ferguson, R.I., Sinuosity of supraglacial streams, Bulletin of the Geological Society of America, v. 84, 251-256, 1973.

Parker, G., Meandering of mupraglacial melt streams, Water Resources Research, 11(4), 551-552, 1975.

Wednesday, September 14, 2011

Batu Tara, Indonesia, spectacular photo

Batu Tara, August 18, 2001
Photo by Thorsten Bockel-http://www.tboeckel.de
VPOW featured this beautiful image this week. I was fascinated by the features at the lower left and center bottom--they look like fireworks on July 4, but come, instead, from the impact of volcanic bombs on the slopes near the vent.

Batu Tara is a small stratovolcano that forms an isolated island in the Flores Sea. Normally covered with vegetation, its first historical eruption occurred from 1847-1852, and the current eruption cycle, starting in 2006, is only the second. A pilot reported an ash cloud that year, but there was no other confirmation.  In 2007, MODIS infrared satellite data showed thermal anomalies.  A continuous low-level plume developed on March 15, 2007, and residents on an island about 50 km south reported a 500-1500 m plume. Lava flows were observed in April of that year, and ash plumes were fairly continuous. Here is the Smithsonian compilation of monthly reports on the activity.