Welcome!

This blog provides commentary on interesting geological events occurring around the world in the context of my own work. This work is, broadly, geological fluid dynamics. The events that I highlight here are those that resonate with my professional life and ideas, and my goal is to interpret them in the context of ideas I've developed in my research. The blog does not represent any particular research agenda. It is written on a personal basis and does not seek to represent the University of Illinois, where I am a professor of geology and physics. Enjoy Geology in Motion! I would be glad to be alerted to geologic events of interest to post here! I hope that this blog can provide current event materials that will make geology come alive.

Banner image is by Ludie Cochrane..

Susan Kieffer can be contacted at s1kieffer at gmail.com


Sunday, September 16, 2012

Typhoon Sanba--and what is a "super typhoon"?

Sanba--NOAA image
Typhoon Sanba is churning away in the Phillippine Sea, having hit Okinawa and moving north toward South Korea and, eventually, China.  Sanba can't be aware of it, but it's got two friends in the eastern Pacific--Kristy and Lane-- and one in the Atlantic--Nadine--that NOAA is keeping track of. Sanba is going to encounter warm water for the first half of its trip between Okinawa and South Korea, but cooler water on the second half. That should at least be some help in moderating its intensity before it strikes South Korea, but it is still expected to be severe. China is already calling on residents to prepare for the storm. The possibility of landslides looms large there.

Sanba has been called (briefly) a super-typhoon. In a previous post, I discussed super-typhoon Tracy, which was so large that it would have covered the whole western half of the U.S. Sanba, like Tracy, is a huge storm.

Projected trajectory for Sanba. NOAA image.
However, sheer size doesn't make a super-typhoon. To be officially a super-typhoon, a cyclonic (rotating) storm must have winds that reach "maximum sustained 1-minute surface winds" of at least 150 miles per hour (65 m/s, 130 knots). It is the equivalent of a strong category 4, or category 5, hurricane in the Atlantic on the Saffir-Simpson scale, or a category 5 "severe tropical cyclone" in the Australian basin. As an example, super-typhoon Pongsona that hit Guam in 2002 had gusts to 173 mph, and sustained winds of 144 mph. This storm also was huge, with an eye almost 40 miles in diameter.

Sanba formed from a tropical depression on September 11, and fueled by warm water, had maximum sustained winds of 175 mph, with sustained winds to about 200 mph (information from earthsky.org here.) It made landfall in northeastern Okinawa early Sunday morning at 6:30 a.m. Okinawa time (5:30 p.m. east coast time in the US). The eye was nearly half the islands length in diameter. At this time, the maximum sustained winds were down to 120 mph, and gusts were measured up to 149 mph. (The Joint Typhoon Warning Center is the U.S. miliary agency responsible for issuing tropical storm warnings in the Pacific.)

Here are other posts on typhoons:

Megi: Taiwan
Tracy: Australia, Queensland
Irene: U.S. east coast
Yasi: Australia

Thursday, September 13, 2012

Mirages

Mirage in Puget Sound
Image from the referenced Cliff Mass blog
A blog that I really enjoy is by Cliff Mass, a meteorologist, on the weather, climate, and meteorology of the Pacific Northwest. There is a really great discussion today (September 12, 2012) of mirages and the atmospheric conditions that produce them. Check it out!


Wednesday, September 5, 2012

Earthquake and possible tsunami near Costa Rica--criteria for a tsunami

Location of today's earthquake
From CNN.com
At 8:42 a.m. today, a magnitude 7.6 earthquake struck offshore 88 miles from San Jose, the capital of Costa Rica. It was located at 40 km (25 miles) depth. A tsunami alert has been sent out for the Pacific coasts of Central and South America.  Here is a link to the USGS description of the tectonic setting of the quake.

I'm not sure what all of the official criteria are for a tsunami, but here are a few factors that are important:
Not all earthquakes generate tsunamis, a problem that causes nightmares to tsunami forecasters. When should a warning be issued?  When should one not be issued?  To forecast whether or not a tsunami will form and how big it might be, geophysicists and oceanographers work together with complicated data analysis and modeling software on huge computers that continuously monitor seismic signals coming through the earth. It takes about 25 minutes for seismic waves from an earthquake to reach all stations of the global seismic arrays and another ten minutes for computers to crunch the data through models. (I recently discovered that the USGS sometimes learns about the occurrence of an earthquake via text messages even before the seismic waves arrive at stations! How cool is that?!!)
Officials can now issue a preliminary estimate of tsunami danger in less than an hour after a quake. During this hour after an earthquake, scientists are searching for four pieces of information that determine the likelihood of a tsunami: the geometry of the fault motion, the energy and depth of the earthquake, and the depth of water over the fault rupture zone.
Some earthquakes produce tsunamis, others do not. Earthquakes in which the dominant motion is lateral, so-called “strike-slip” like that on much of the San Andreas fault in California, do not generate tsunamis. They form, rather, during quakes in which rocks have some vertical motion along a fault, causing a bulge or depression to form in the water. Such quakes, known as “tsunamigenic” earthquakes, occur in the subduction zones of plate tectonics—primarily those bordering the Pacific Rim, where two thirds of all tsunamis occur, but also in the Indian Ocean, the Caribbean, and the Mediterranean. During the Tohoku earthquake, an area of nearly six thousand square miles--the size of Connecticut--thrust up as much fifteen feet, disturbing an enormous volume of water. Oceanographers need to know the depth of the ocean over the rupture zone because the more water above the displaced crust, the more water that moves out into the tsunami.
The energy of an earthquake and the process of transmitting the energy to the water are both related to the area of the displaced ground and how far it moves during the quake, its displacement. Both of these quantities are captured by the seismic moment, a quantity that is related to the Richter magnitude. This relation of magnitude to area and displacement of the crust is the reason that estimates of the magnitude of the earthquake are so important in prediction of the size of a tsunami. Boxers understand this piston physics well—a big fist thrown in a long punch is more powerful than a small fist with a short reach. 
The potential for devastation by a tsunami depends on the fault geometry in one another way. Waves from a fault rupture are bigger in some directions than in others.  Waves spreading away from the long sides of a rupture--that is, spreading perpendicular to the fault plane--tend to be much bigger than those that spread away from the tips of the fault, parallel to the fault plane. If two coastlines are at equal distances from a fault, the one perpendicular to it is more likely to experience damage than the one parallel to it. Because of this geometric effect, Bangladesh—though lying nearly at sea level—was spared much devastation from the Sumatra earthquake.
The depth of an earthquake matters because a tsunami is only produced if the sea floor moves into the overlying ocean. If the earthquake is buried too deep in the crust, the fault that caused it may never break through to the sea floor or, if it does, may be moving too sluggishly to give the water a good punch. Shallow earthquakes with substantial vertical displacements and high moment magnitudes generate the largest tsunamis. The depth of water over the displaced crust matters because it, along with the area of the displaced crust, determines the initial volume of water displaced and able to move into the tsunami.


**This is an excerpt from my forthcoming book "The Dynamics of Disaster", due out summer 2013 from Norton Press. It can be preordered from Amazon.com here.

Tuesday, August 28, 2012

Hurricane Isaac--What's the "reason" for hurricanes?

Cover for my book
Due out February 18, 2013
Norton Press

A dear friend of mine who is facing her first big hurricane in New Orleans said that she heard a meteorologist on the Weather Channel comment today that there was a "reason" for hurricanes:

I found it interesting, though, that [the meteorologist] said a “reason” as if either 1) God had  a plan for earth and hurricanes are a part of it or 2) hurricanes were living beings with an innate reason for doing something, like fish swimming upstream or something.

Is there a “reason” for hurricanes?  Do scientists consider “reason” the appropriate word?  Or is the better word “consequence” or “result”? 

Hurricane Isaac is eerily following the same path as Hurricane Katrina and the same time-line--seven years later. Due to make landfall in Louisana later today, Isaac is likely to drop 15-18" of rain just off the eastern toe of Louisanna and southern toe of Mississippi. 

Predicted rainfall over 5 days for Isaac. Prediction is for 5-day period
beginning 8:00 a.m. EDT August 28 through 8:00 a.m. EDT Sept. 2.
NOAA/NWS/NCEP/HPC
The maximum rainfall is in the small lime-green circle just
off the eastern coastline of Louisana and southern coastline of
Mississippi.
What is the "reason" for hurricanes? Leaving aside the tendency of meteorologists (and all of us) to  anthropomorphize hurricanes (after all, why give them names when numbers would do just as well or better?), there is a scientific "reason" for hurricanes--it is part of the process that results in the most efficient way that the earth has of redistributing heat away from the equator toward the poles.

Energy pours into the earth from our sun, but it does not pour in equally over the surface of the earth. Much more energy accumulates at the equator than at the poles. The atmosphere and oceans work as a coupled system to transport the energy from the hotter regions toward the colder regions. In a (very) simple world, there would be a single convection cell doing this transport: Warm air would rise at the equator and flow toward the poles, cooling along the way. Near the poles it would sink and flow back along the surface of the earth toward the equator, warming along its path. This model, first proposed by George Hadley, in the 18th century, consists of a single giant convection cell. Unfortunately, it doesn't explain the way that the atmosphere works.

A hundred years after Hadley proposed this model, Gaspard-Gustave de Coriolis and William Ferrel came up with models that explained the major wind directions on the surface of the earth. Coriolis pointed out the effect of the rotation of the earth on wind direction, and Ferrel proposed, correctly, that there were three, not one, convection cells, each spanning roughly 30 degrees of latitude. The three cells are called, in order of distance away from the equator, the Hadley, Ferrel, and polar cells. 

The temperature gradients across the Hadley and polar cells are fairly small: a traveler could traverse a Hadley cell in the northern hemisphere from south to north and the weather would change only from tropical to subtropical conditions. Across a polar cell, it would change only from polar to subpolar climates. But, a tourist traveling through the northern hemisphere Ferrel cell would go from the humid warmth of New Orleans almost up to the freezing conditions at the Arctic Circle.

The very large temperature gradients in the Ferrel cells, combined with the complicated role of the continental land masses, causes enormous turbulence in the atmosphere. Turbulence is, loosely, a very complicated flow regime in which individual parcels of fluid mix on many scales, from the tiniest molecular scale to the largest scale that has the dimensions typical of the whole atmosphere. The individual "parcels" of fluid are "eddies," and the largest eddies carry most of the kinetic energy of the motion. 

You can envision this process by observing a pot of water come to a boil on your stove. Initially, when you turn on the heat, the water is at a nearly uniform temperature--whatever the temperature was when it came out of the faucet. As heat pours into the bottom of the water, the temperature gradient across it increases. Initially, the heat is transported by conduction--molecule-by-molecule collisions of water. Then, convection (transport by physical motion) starts. Initially the convection is "gentle" (the technical word is "laminar"), but when the temperature gradient becomes too large, the convection becomes "turbulent." The water is roils in the pot as hot and cold parcels mix and merge to transport the heat as efficiently as possible.

So, too, in the atmosphere, turbulent mixing is the process that makes heat transport around the planet as efficient as possible. The fluid parcels that mix range in scale from huge (the dimensions of the atmosphere, tens, hundreds, even thousands of kilometers) down to "tiny" (dust devils or tornadoes). Hence, the "reason" for hurricanes is they play a major role in transporting heat around the planet. The words "consequence" and "result" are, as my friend said, much better than "reason": hurricanes are the inevitable consequence of the uneven distribution of solar heating of the earth, and the laws of thermodynamics that describe how this unevenness is smoothed out by heat transport.

These concepts are explained in more detail in my book "The Dynamic of Disasters," due out on February 18, 2013, by Norton Press. Here's a description on Amazon!

Sunday, August 19, 2012

What's going on in the Himalayas? Are the glaciers receding or advancing?

Image showing the extent of the Himalayas from
the west near the dry steppes of Afghanistan to the
wet subtropics of Bhutan in the east
Photo from an article by Devin Powell in Science News,
vol. 182 (#4), August 25, 2012 edition obtained from Google.
Glaciers may only move slowly, but they are "geology in motion," and obey conservation of mass principles that are fairly easy to understand. If more moisture is added to a glacier by precipitation, or in some areas, by avalanches, than is lost by melting and sublimation, the glaciers grow, and vice versa.

There has been much speculation over the past decade that the melting of the glaciers in the Himalayas might cause the rivers that nurture a huge land mass to decline, causing water supply stress for 200,000,000 people in India and China. Recent work has led to the realization that such generalizations cannot, and should not, be made because of the Himalayas are so huge extent and the climate and weather vary considerably along their length.

There is little controversy over the fact that the climate is warming in the Himalayas, and that some glaciers are suffering, particularly in the east.  On the other hand, some western glaciers in the Karakoram are growing. The Karakoram is part of the greater Himalaya (which includes the Hindu Kush and other ranges), north of the actual Himalaya Range. The Karakoram includes K2, the second highest peak in the world, at least 20 other peaks over 7,000 meters, and more than 100 peaks over 6100 meters (20,000 feet).

In 2005, Kenneth Hewitt documented evidence that many glaciers in the central Karakoram region were expanding.** These glaciers were "almost exclusively" in basins at the highest elevations. They had been diminishing in size through the mid-1990's and suddenly started expanding, which is a puzzle not yet solved. The flows in the Indus and Yarkand rivers in the western Himalayas have been declining in spite of the glacier expansion, indicating that the extra ice is being stored in the glaciers rather than providing water to the rivers.

Glaciers in the Karakoram generally start in steep tributaries typically between 4500 and 5500 meters, where they consist of icefalls and avalanches that coalesce to form the main ice mass in the drainages. The ice is fairly thin and highly cravassed. Conversion from snow to glacier ice occurs on the time-scale of years or decades rather than centuries as occurs in other places around the world. Much of the movement occurs by collapse of unstable sections rather than by gradual slip along the base of the glacier. Because of the fragmented nature of the ice, more of it is exposed to ambient atmospheric conditions and to meltwater than glaciers which are less heavily fractured.

In the Karakoram, there are three distinct weather systems. Two thirds of snow accumulation on glaciers here occurs in the winter when a westerly circulation and cyclonic storms provide moisture. The remaining 1/3 accumulation occurs during summer snowfall.  Solar radiation during the two other weather systems when clear weather occurs accounts for most of the glacier ablation. Since the early 1960's winter precipitation has increased and summer mean and minimum temperatures have declined.

Hewitt strongly warns that the expansion of the Karakoram glaciers does not refute the case for climate change or for atmospheric warming. Rather, warming is the only way to explain these changes with the warming causing the transportation of moisture to higher altitudes than before, thus explaining the growth of the high-altitude glaciers.

**Hewitt, Kenneth. "The Karakoram Anomaly? Glacier expansion and the 'elevation effect,' Karakoram, Himalay, Mountain Research and Development, November 2005, 332-340. This paper gives an excellent general discussion of the dynamics of glaciers.

Tuesday, August 14, 2012

Why don't mosquitos get killed by raindrops?

Mosquitos ride raindrops instead of resisting them
Photo by Tim Nowack, Andrew Dickerson and David Hu
featured in ScienceNews article by Susan Milius on
July 14th, 2012.
Sometimes I wonder why I never thought of such an obvious question as the one in this title!  If we humans are hit by something that weighs a few hundred or a thousand pounds, we don't survive. A raindrop can weigh 2-50 times as much as a mosquito, and yet plenty of them survive rainstorms.

In a paper on PNAS (reference below), Dickerson et al. calculated that the impact force of a raindrop on an unyielding surface is 50,000 dynes, about 10,000 times the weight of a mosquito. Should be lethal. They also calculated that a stationary mosquito in a rainstorm should get hit, on average, every 25 seconds.

The authors put mosquitoes into a small acrylic cage. In one experiment, they simulated the terminal velocity of raindrops (6-9 m/s) by using a pump to generate a jet that broke up into drops and jetting streams. They managed to observe six mosquitoes, and found that they tumbled with the jet. The mosquitoes were accelerated to a velocity of 2.1 m/s within a duration of 1.5 milliseconds. All six mosquitoes survived the experiment and flew around after a brief rest.

Using high resolution and fast films, they used slower drops to examine the response to drops. They were able to observe the dynamics of the interaction when the impacts were on the wings or legs (N=13) and on the body (N=4). The mosquitoes rolled when hit on the legs and wings, but if the drop made a direct hit on the insects center of mass, it pushed the mosquito downward, accelerating it within downward several (5-20) body lengths. The mosquito was always able to separate itself from the drop and recover its flight. As the authors point out, it is "imperative that a mosquito does not fly too low during rain or it will suffer a secondary impact with the ground." They also did experiments on "mosquito mimics."

The key to survival is that the low mass of the mosquito causes a falling drop to maintain almost all of its speed after impact, thus resulting in a low impact force to the mosquito. The paper contains some nice and understandable physics of impact.

The work has implications not only in biology and ecology, but also for the construction of insect-sized flying robots.

Reference: Dickerson, A.K., Shankles, P.G., Madhavan, N.M., and Hu, D.L., "Mosquitoes survive raindrop collisions by virtue of their low mass." Proceedings of the National Academy of Sciences, June 4 online 2012. doi:10.1073/pnas.1205446109.

Friday, August 10, 2012

A raft of pumice in the Pacific

A part of the pumice raft
Photo from CNN.com
Driving to work this morning, I heard a headline on NPR about a floating raft of rocks out in the Pacific and, sure enough, Google worked and I found the pictures! On Thursday, pilots and sailors from the New Zealand navy discovered pumice, sometimes inches high and looking like floating ice, covering an area estimated to be more than 7,500 square miles. It appears to be an oblong area 250 x 30 nautical miles in dimension.  Volcanologists love to try to reconstruct the "equivalent magma volume" that it would take to produce this--was it a cubic mile? a fraction of a cubic mile? However, unless we know how much of the surface it covers (1%? 50%?), what it's average thickness is (a few inches?), and especially, what the density of individual pieces is, we can't make that calculation. We do know for sure that the density is less than 1 g/cm3 (the density of water), and some older studies of pumice from a Japanese caldera eruption showed that the density varied between 0.211 and 0.777, with an average of 0.51. My guess (with no measurements at all) is that the pumice in the above photo covers about 5% of the frame, and this is probably a photo selected because it has lots of pumice. Let's assume that it covers 1% of the 7500 square miles, to an average depth of 6". If I did my math right, this is a depth of 0.0001 mile, and so the volume of the pumice would be 7500*0.0001 = 0.75 cubic miles. If the average density of the pumice is about 0.5, then the erupted volume would have been a few tenths of a cubic mile.  A pretty healthy burp.

***Note added on August 11: Scientists initially (as of yesterday) thought that the eruption was from Monowai, a volcano that I posted about an eruption a year ago. However, as of today, they have determined that the raft was spotted first on July 19, whereas Monowai didn't erupt until August 3. They now believe that the eruption was from an unknown volcano about half way between New Zealand and Tonga. There were more than 157 earthquakes between magnitude 3 and 4.8 in this area between July 17 and 18. This information is from Stuff.co.nz. There is also a 36 second video from the air of the raft on this site. My guess from looking at the video is that my estimate above of an aerial coverage of 1% may be high by as much as an order of magnitude because the still photo in the upper left is definitely one of the highest density areas. So, perhaps a few hundreths of a cubic mile equivalent magma volume, with a few tenths as an upper bound.

Pumice rafts have been observed before. There has been speculation (sorry, I don't have a reference) that they could have been a platform on which life originated on earth--a platform on which a soup of organic chemicals from hydrothermal vents in the ocean could have accreted, been zapped by lightning to form the complex organic molecules leading to life. It has also been proposed that life could have migrated from island to island in the Pacific, or from continent to island, e.g., South America to the Galapagos, on such rafts.

More recently, Scot Bryan of Queensland University of Technology, has studied pumice rafts from the 2001 and 2006 eruptions in Tonga, and suggested that they could have been crucial in the formation, evolution, and future of the Great Barrier Reef off of northeast Australia. Bryan's studies showed that the initial 440 square kilometer floating mass of pumice broke into streaks on which "millions to billions" of marine organisms such as cyanobacteria, barnacles, molluscs, corals, anemones, and crabs, started hitchhiking. As the fragmented raft wandered more than 5000 kilometers over 8 months, 80 species of plants and animals journeyed along with it. When the corals, coralline algae, anemones, and other reef dwellers that were hitchhiking got the the Reef, they simply decided to call it home (well, a bit of an anthropomorphism!!).

Bryan views this as a positive thing because it may indicate that volcanic activity in the Pacific can replenish the Reef, which is stressed and dying in the warming waters around it.  On the downside, however, there are some marine pests such as sponges and mussels that journey along as well.

Bryan's research is featured in this Phys.org article from which I obtained this information, and in the technical article by Bryan et al., "Rapid, Long-Distance Dispersal by Pumice Rafting," in PLOS-ONE, a peer-reviewed, open access journal.

Thursday, August 9, 2012

It's the Olympics--Take a lap on corn starch!

The corn-starch experiment. Figure from
van Hecke's summary referenced below.
Have you ever wanted to walk on water? Here's a great YouTube video on non-Newtonian fluids, featuring the "Goop du jour" and how to do it (well, not quite walking on water, but close!)

In an article* in the July 12, 2012 issue of Nature, two physicists from the University of Chicago explain the physics behind this phenomenon, and take issue with older theories that it is caused by "shear thickening." This work has implications for our understanding of blood flow, cement and clays, all of which can exhibit shear thickening. Waitukatis and Jaeger propose that the shear thickening is not due to shear, but to compression.

In a series of experiments in which they plunged a rod into vats of cornstarch in water and water mixed with glycerol, and observed the process with fast video, X-ray imaging and other sensors, they found that below the point of impact of the rod, a cone of solidification developed. In this zone, the material had the properties of a solid...briefly. As you will see from the YouTube video above when both a bowling ball and a man sink, the solid state only lasts a fraction of a second, or as long as the material is agitated.

The proposed mechanism for this thickening relies on particle jamming, and the size and dynamics of the zone depend on conservation of mass. Jamming occurs when the particles get close enough together to become densely packed and form a solid. Conservation of mass leads to predictions of the size (depth) of the solidified zone. The solidified zone absorbs the momentum of the impacting rod, providing the force that stops its motion. Interestingly, they were able to exclude some other effects with clever experiments. By adding a 1-cm deep layer of water to the surface of the suspension, they reduced the surface tension to zero, and ruled out liquid-air interface effects. By adding glycerin to the water, they increased its viscosity by more than an order of magnitude, finding little effect on the parameters during compression of the water, but a strong effect on the sinking of the rod into the mixture after the impact.

The work has practical applications, from preventing cement from bulking up and breaking pipes when poured to design of sports gear or body armor to absorb impacts and vibrations.

A 22 second video is available from this article by Devin Powell in Science News.

*Waitukaitis, S.R. and Jaeger, H.M., "Impact-activated solidification of dense suspensions via dynamic jamming fronts." Nature, 487, 205-209, 2012, with a very nice summary by Martin van Hecke of Leiden University, Netherlands, on pages 174-175.

Wednesday, August 8, 2012

Mars lander "Curiosity" is on the surface

It will be impossible to outdo the NASA press releases on the exciting mission now underway on the surface of Mars. So, for my international readers who may not be receiving so much information on the mission, here is the JPL link to Curiosity, as well as to the two previous landers, Spirit and Opportunity:

http://marsrovers.jpl.nasa.gov/

Enjoy!

Saturday, July 21, 2012

Tour de France and the dynamics of bicycle pelotons

After spending three months in Durham, England, and taken a vacation from blogging for six weeks (amazing what it does to the hit count on a blog!!), I thought that I'd restart with a look at the dynamics of the peloton that plays such a role in bicycle competitions since tonight is the next to final day of the Tour de France. Kudos to the apparent victor, British Bradley Wiggins!

I found a very interesting paper "The self-organized complex dynamics of bicycle pelotons," by Hugh Trenchard.  I do not have not got a citation for this paper, it appears to be a book chapter submission under revision, and is available here on the WWW. The link to the author on the top of the first page says that he's interested in self-organized complex adaptive systems, with special emphasis on the pelotons.  An eclectic interest and a very interesting paper. I hope that it does get published!

Briefly, a peloton is a group of cyclists riding in a group.  It can consist of as few as two cyclists, but amongst the competitive cycling community, it usually means a large group of cyclists riding in (frighteningly close) proximity. An indication of the massiveness and effects of the peloton was indicated today by a radio commentator who was at the roadside as the cyclists emerged from the French Pyrenees, describing the strong wind that they generated as the blew by and the smell of burning rubber from the hundreds of cyclists all using their brakes at the same time!

Cyclists in the front and, to a certain extent, on the sides, experience the highest air pressure and resistance to their motion, and cyclists behind the leaders or inside the periphery experience a reduced air pressure. Riders who are behind the leaders are "drafting." According to Trenchard's paper, the energy saved by being in a drafting position is reduced by 18% at 20 mph, 27% at 25 mph, and 39% at 40 km/hr for a peloton of eight riders. Cycling is an incredibly strategic competition, and stage races like the Tour de France that extend of many days and weeks are a complex mix of individual and team strategies. No rider can sustain the lead forever, and so riders on a team change leads frequently. If one individual has been designated as the team leader who all others are to support in order that the victory be his/hers, then team members subordinate their own desire for individual victory to support a team victory. This has had some interesting dynamics in the last days of the current Tour.

Trenchard presents two models for the dynamics of the peloton. The first is an energetic model that looks at individual, coupled, and globally-coupled energy output thresholds. The second is an economic model that incorporates competition and cooperation dynamics, using basic game theory.

Without going into any detail, I'll summarize a bit of the results of the energetic model.  Phase I ("Disordered-relaxed") begins immediately upon start of the race as the cyclists begin to accelerate in a pack.The pack is fairly disordered, low density, unstable, and undergoing increasing speeds and pack density. This phase can occur during the outset of a race or during temporary relaxations after periods of high energy output.  This phase can last only a few seconds in some instances before the onset of Phase II ("Peloton rotation/convection rolls"). In this phase, speed, power output and energy expenditure also increase but are not at the physiological thresholds of the riders. In this phase, the group has a maximum density. The system exhibits convection roll dynamics called "peloton rotations," not unlike the rotation of Emperor Penguins in the Antarctic or convection in Rayleigh-Bernard heating. This phase is stable and comprises the largest proportion of time during a typical race.

In Phase III ("Single paceline, synchronized") speeds are synchronized and riders align in single file. This is a phase of high power output and energy expenditure and riders are very near their physiological thresholds.

In Phase IV ("Disintegrated") riders are exhausted and the peloton disintegrates. There is a low density but still fairly high energy output. This phase is unstable, and may lead to a reintegration through phase I dynamics.

Wednesday, June 13, 2012

Taxis, balloons, kids, and a bit of dynamics

 
I spent last weekend in Edinburgh, Scotland, where I saw a wonderful parade. (Remember that taxi's in the U.K. have a very distinctive style! )

The taxi driver who took me from the train station to my hotel on the weekend when I arrived mentioned that on Tuesday the taxi drivers volunteered their services to take handicapped children on a parade and for a day at the sea--BBQ's, games and all-day fun.

They decorate their taxis with balloons for the day. Last year, he and his wife had risen at 4:00 a.m. to decorate their taxi with 300 balloons, only to have a strong wind come up and strip most of them off before the parade even started! 

Why does this qualify for a "fluid dynamics blog" (except for fun!)?
Because I'd never thought about how to attach 300 balloons to a car and keep them there for a day! Have you? 

They tie a mesh net on top of the car, and tie the balloons to the net. Unfortunately, the swaying of the balloons in the wind moves the net, which tends to damage the paint job on the car. My hat's off to these taxi drivers and their volunteer efforts.

Oh, yes--another taxi driver warned me in advance--they provide the kids with water guns to soak the spectators! Can you see the kid with the water gun in the photos!

Again, kudos to the taxi drivers who devote their day to this event!


Thursday, May 31, 2012

What can seismicity tell us about subterranean volcanic activity?

A zoned orthopyroxene. This example is NOT
from the paper being discussed. It is from here.
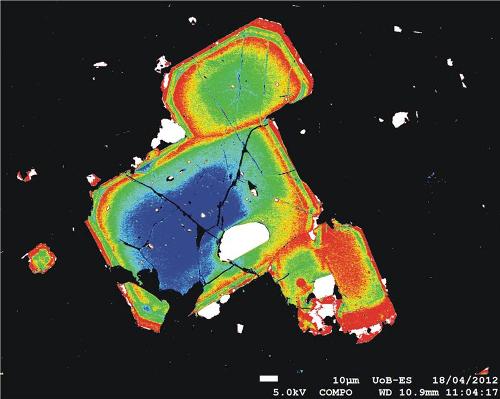
In a Science paper*** last week, Saunders et al. present a tantalizing relationship between episodes of seismicity at active volcanoes, the growth of rims on small crystals (of orthopyroxene), and intrusion of new batches of magma into shallow levels of the system. The underlying science is that the composition of crystals growing in a magma responds to any changes in the conditions of the magma--composition, volatile content, temperature, pressure, and oxidation state. Saunders et al. examined iron (Fe)-magnesium (Mg) zoning in 579 orthopyroxene crystals takenfrom Mount St. Helens eruptions between 1980 and 1986. They found four categories of zoned crystals: some with Fe-rich cores and Mg-rich rims, so-called 'reverse-zoned' crystals; some with Mg-rich cores and Fe-rich rims, so-called 'normal-zoned', multiply zoned, and patchy zoned. By modelling diffusion of elements they calculated that the crystals formed in <12 months. The authors attribute the zonation to changing oxygen fugacity and H2O concentrations.

The cores of the opx crystals appear to have been entrained from an old, partially crystallized magma. Normally zoned crystals may have resulted from rapid cooling of crystals suspended in a new magma pulse as they intrude into the reservoir, or of rapid crystallization induced by fluxing with CO2-rich gas. Reversely zoned crystals may have been produced as crystals already in the chamber are subjected to heating by the intruding magma. These crystals are first partially resorbed, and then overgrown with a Mg-rich zone that is in equilibrium with the new hotter, adjacent mel. Unzoned crystals are ambiguous and the authors offer several interpretations.

The authors then took the date that the crystal was erupted and subtracted the rim growth time to obtain the month in which the opx rim began, presumeably due to a magmatic perturbation. They plotted these dates on a graph of the seismicity and SO2 emission flux and found that the peaks in the growth dates corresponded to episodes of deep seismicity, especially in 1980 and 1982. The implication is that at least in some instances, the seismicity is related to intrusion of magma.

***Saunders, K., Blundy, J., Dohmen, R., and Cashman, K., Linking petrology and seismology at an active volcano, Science, 336, 1023-1027, 2012.

Friday, May 18, 2012

Landslide in Swiss Alps, phenomenal footage

On CNN today (May 18), there is an amazing video of a 300,000 cubic meters landslide in the Swiss alps. It's stable footage from a helicopter. Perhaps as impressive as the landslide are the obvious fractures in the ground that has not yet failed but will inevitably go. One of the rips goes right through a barn. It is at Preonzo, Switzerland, according to a YouTube version.

Thursday, May 17, 2012

The biggest sandbox in the world....?

 A: Seismic section with gamma-ray log
 B, C: Samples from upper part of upper sand
(white arrow in SWC in A)
(I'm being a bit lazy here, because I'm working on a PC instead of my trusty Mac and can't figure out even the simplest operations, so I'm  just cutting-pasting in directly from this very interesting article in Geology "World's largest extrusive body of sand?" by Helge Loseeth, Nuno Rodrigues, and Peter Cobbold,Geology, 40(5), 467-470, 2012 )

During the 1812 New Madrid earthquake (southeastern United States), individual bodies of sand as much as 2 m thick appeared patchily over a 4000 km2 area. The sand volume was estimated to be to be 105–107 m3 and there were claims that it was the largest reported extrusive sand (extrudite). There have been no reports of extrusive sands as voluminous as several cubic kilometers. Typically, extrusive sands connect to their parent sandbody or sandbodies in the subsurface via hydraulic fractures.

Using three-dimensional seismic and well data from the northern North Sea, Loseth and colleagues describe a large (10 km3) body of sand and interpret it as extrusive. To their knowledge, this is the world's largest such sandbody. It would bury Manhattan, New York (60 km2), under 160 m of sand, or the whole of London, UK (1579 km2), under 6 m of sand. This sand vented to the seafloor, when it was more than 500 m deep, during the Pleistocene glacial period. The sandbody (1) covers an area of more than 260 km2, (2) is up to 125 m thick, (3) fills low areas around mounds, which formed when underlying sand injectites lifted the overburden, (4) wedges out, away from a central thick zone, (5) is locally absent along irregular ditches, 20 km long and up to 50 m deep, which overlie feeders on the flanks of the mounds, and (6) consists of fine-grained to medium-grained, sub-rounded to rounded grains.

A pretty big sandbox to play in!!

Tuesday, May 15, 2012

Monowai volcano: fast outpouring of magma observed over 5 days

Bathymetry of summit of Monowai Cone May/June 2011.
How fast can a volcano spew out magma? This is a question that has perplexed volcanologist for a very long time.  Recently a team of scientists, led by A.B. Watts of Oxford University,  conducting a routine bathymetric survey onboard the research vessel  SONNE, were fortunate enough to be in the proximity of Monowai seamount volcano when a dramatic eruption occurred.**  Monowai is located along the 2,500 km-long Tonga-Kermadec Arc, where a submarine volcano can be found approximately every 50 km.
Eruptive volume versus duration of magmatism for submarine volcanoes.
Monowai is not small. It is a 10-12 km-wide strato-volcanoe approximately 1 km high with a 7-10 km wide caldera in its summit, approximately 0.6 km deep. Since it was first discovered in 1944 it has had a history of activity (discoloured water emanations and seismic ity). On May 14, 2011, the scientific team observed gassy discoloured water on the summit of the Monowai Cone. Three days later, a swarm of seismic events began and lasted for 5 days. On June 1, after the seismic activity subsided, the ship returned and carried out a second survey of the cone. They found significant changes in depth at the volcano. The main differences were (1) an increase in depth of up to 18.8 meters attributed to collapse structures on the flanks of the volcano, and (2) a decrease in depth of up to 71.9 m due to growth by eruption of new lava flows. The most striking feature of the surveys was a new cone near the summit. From its dimensions (100 m diameter at its base, at least 40 m high), it appears that about 0.00875 cubic kilometres of magma was erupted, most likely during the 5-day swarm of seismic activity. Extrapolating these rates to annual output, Monowai joins Kilauea, Iceland, Montserrat, the Azores, Hawaii, and the Canary Islands withoutput on the order of 0.1 cubic kilometres per year.

**Reported in A.B. Watts, et al., Rapid rates of growth and collapse of Monowai submarine volcano in the Kermadec Arc, Nature Geoscience, Advance publication, doi: 10.1038/NGE01473, posted May 13, 2012. Featured on Geology.com on May 15, 2012.