Welcome!

This blog provides commentary on interesting geological events occurring around the world in the context of my own work. This work is, broadly, geological fluid dynamics. The events that I highlight here are those that resonate with my professional life and ideas, and my goal is to interpret them in the context of ideas I've developed in my research. The blog does not represent any particular research agenda. It is written on a personal basis and does not seek to represent the University of Illinois, where I am a professor of geology and physics. Enjoy Geology in Motion! I would be glad to be alerted to geologic events of interest to post here! I hope that this blog can provide current event materials that will make geology come alive.

Banner image is by Ludie Cochrane..

Susan Kieffer can be contacted at s1kieffer at gmail.com


Tuesday, February 11, 2014

u

Ice storms are very bad for trees! NOAA image from here.
(I have no idea how blogger put the "U" on this post, nor any idea how to get rid of it....Grrrr....)

The CNN  headline today is "Forecast: Historic, crippling, catastrophic ice: Atlanta prepares for the worst." It is well known that freezing rain storms occur frequently in the southeastern part of the U.S. They are beautiful, but dangerous and costly.

And, they are not all that rare. Montreal, Quebec, typically receives freezing rain more than a dozen times a year. In 1998 the great North American ice storm of January 5-9 was one of the most damaging and costly ice storms in North American history, causing massive power outages on the east coast. Eastern Canada bore the brunt of the storm. Millions were without power for days to weeks to even months. 35 people died, a significant number from carbon monoxide poisoning from generators they used to try to keep themselves warm. The effort to reconstruct the power grid led to the biggest deployment of Canadian military personnel since the Korean War.
What makes an ice storm? The attached graphic from Gay and Davis summarizes the types of precipitation nicely and, when I read their paper, I learned a new word: "hydrometeor." It is "any water or ice particles that have formed in the atmosphere or at the Earth's surface as a result of condensation or sublimation." Examples are clouds, fog, rain, snow, hail, dew, rime, glaze, blowing snow and blowing spray.

Vertical temperature profiles in the atmosphere and
the kind of storms that they produce. From Gay and Davis,
1993 here.
The graphs shown here summarize the general conditions under which snow, sleet, freezing rain, and rain land on the ground within the context of the atmospheric temperature distribution.** Consider the situation when a warm front moves in.  If warm front isn't too strong, the atmosphere remains cold (below freezing) throughout, and precipitation falls in the form of snow. But, as a warm front moves in, an inversion layer develops with cold air near the surface under the warm air aloft. If snow starts falling aloft and encounters this warm air, the snowflakes melt. A mixture of frozen and unfrozen "hydrometeors" develops in the warm layer (left side of the Figure shown here). As these hydrometeors fall into the near-surface cold layer, they get supercooled. Any icy snowflakes that didn't melt as they traveled through the warm layer become efficient sites for refreezing, and a mixture of snow, ice, and some liquid falls to the ground, i.e., sleet. As the warm layer develops (gets warmer and thicker), all of the snowflakes melt as they travel through it. Without nearby ice particles to serve as nuclei, these become supercooled as they fall through the cold layer near the ground, i.e., they are supercooled liquid. When they land on cold ground, they freeze, producing freezing rain. If the liquid droplets formed in the warm layer reach ground that is above freezing temperature, the precipitation is cold rain.

As the warm front develops, it is common to see a sequence of precipitation progress from snow to sleet to freezing rain to rain.  The reverse situation occurs with cold front events in the southern Plain states.

A few factlets from Wiki: The thickest recorded ice accumulation from a single ice storm in the U.S. is 8 inches (northern Idaho, January 1961). In February 1994 a severe ice storm caused over $1 billion damage in the southeast.

**This discussion is from David Gay and Robert Davis, "Freezing rain and sleet climatology of the southeastern USA," Climate Research, vol. 3, 209-220, 1993. Notably, they comment that at the time this paper was written, relatively little was known about freezing rain and sleet climatology.

Sunday, February 9, 2014

Meteorite impact craters and their rays

Martian impact crater formed between July 2010 and
May 2012. NASA image ESP-034285_1835
NASA just released this beautiful image of a fresh Martian impact crater. The image came from HiRISE on NASA's Mars Reconnaissance Orbiter taken on November 19, 2013. The age range was pinpointed through the orbiter's "Context Camera" that revealed a change in appearance at that site between July 2010 and May 2012. The crater is about 30 m in diameter, and the ejecta extends out to 15 km. The blue color in this image is attributed by the HiRISE team to removal of reddish dust in the area. Alternatively, I'm wondering if it sue to the veneer of fresh excavated ejecta covering the reddish dust.

In discussing this with a colleague, I pointed out that many of the studies of impact ejecta processes date back to the 1960's and 1970's, and were in the context of where to send an astronaut to explore on the Moon.  If you wanted to sample material from deep in the crust, it would be too hazardous for an astronaut to climb down the walls of an impact crater (believe me, having scrambled around the walls of Meteor Crater in Arizona many times, you do not want to be wearing a space suit while climbing down into an impact crater!). One thought was that you could sample the ejecta by going to the rays of a crater. For example, from this source:

"Lunar crater rays are those obvious bright streaks of material that we can see extending radially away from many impact craters. Historically, they were once regarded as salt deposits from evaporated water (early 1900s) and volcanic ash or dust streaks (late 1940s). Beginning in the 1960s, with the pioneering work of Eugene Shoemaker, rays were recognized as fragmental material ejected from primary and secondary craters during impact events. Their formation was an important mechanism for moving rocks around the lunar surface and rays were considered when planning the Apollo landing sites. A ray from Copernicus crater crosses the Apollo 12 site in Oceanus Procellarum. Rays of North Ray and South Ray craters cross near the Apollo 16 site in the Descartes Highlands and a ray from Tycho crater can be traced across the Apollo 17 site in the Taurus-Littrow Valley on the eastern edge of Mare Serenitatis. There is still much debate over how much ejecta comes from the primary impact site or by secondary craters that mix local bedrock into ray material."

In a 1971 article, Verne Obereck concluded that the bright rays "only reflect local excavation of mare substrate material by myriads of small secondary or tertiary impact craters:"

Observations of high resolution photographs of part of one of the prominent rays of the lunar crater Copernicus show that there is a concentration of small bright rayed and haloed craters within the ray. These craters contribute to the overall ray brightness; they have been measured and their surface distribution has been mapped. Sixty-two percent of the bright craters can be identified from study of high resolution photographs as concentric impact craters. These craters contain in their ejecta blankets, rocks from the lunar substrate that are brighter than the adjacent mare surface. It is concluded that the brightness of the large ray from the crater Copernicus is due to the composite effect of many small concentric impact craters with rocky ejecta blankets. If this is the dominant mechanism for the production of other rays from Copernicus and other large lunar craters, then rays may not contain significant amounts of ejecta from the central crater or from large secondary craters. They may in fact only reflect local excavation of mare substrate material by myriads of small secondary or tertiary impact craters.

Recently, Valery Shuvalov proposed a ray production mechanism based on a large supercomputer simulation. In this simulation, the hypothesis was that rays result from interaction between the shock wave associated with a developing crater and nonuniformities in the target surface. The results of a simulation of the formation of a crater by a 5-km diameter asteroid on the Moon at an impact velocity of 15 km/s are shown in the adjacent figure. This impact would have produced a crater approximately the size of Tycho, a famous rayed crater on the Moon. The target and projectile material were both assumed to have the mechanical properties of granite.

When the shock wave from the developing primary crater hits a depression (preexisting small crater) a jet of material is spalled off the wall of the small crater proximal to the primary crater (upper left in the simulation sequence shown).  In contrast to the effect of a depression on ray formation, a ray-suppressing effect is seen if there is a nearby elevation.

Monday, February 3, 2014

Eruption of Mount Sinabung, in North Sumatra, Indonesia

Photo from CNN.Com by Einsar Bakkara/AP
in the cited article in text
(if I read the credit correctly)
Mount Sinabung, an Indonesian volcano dormant since 1600 came to life in 2010 and, on Saturday, spewed forth pyroclastic flows that killed at least 14 people. Tragically, it appears that these people had been evacuated last summer and only the day before this eruption, had been allowed to return to their villages. The Wiki site for Mount_Sinabung appears to be updated in a timely way, so I won't go into details here.
     It is difficult to tell what the source of the erupted material is in detail, but from photos of the volcano (a classic beautifully conical stratovolcano) and the lack of any indication of lateral bulges on the flank, a good assumption is that the flows are originating in a summit crater. A question/assumption, is whether they are being driven by volatiles (presumably H3) from magma or whether or not groundwater is involved. According to the Wiki article, in late December, a lava dome had formed on the summit.
     The eruption gas/ash material from lava domes results in eruptions known as "Pelean" or "Merapi"-type pyroclastic flows. Two processes contribute to the high-velocities observed from such eruptions: gravitational collapse (supplemented by heating and expansion of entrained air), and sudden expansion of pressurized gases from inside the domes. If gravity controls the energy transfer, then areas affected can be predicted on the basis of topography. If gas expansion adds a significant contribution, which is likely in the proximal region around a dome, then velocities beyond those acquired by acceleration in a gravitational field, exist, and these imply that much larger areas are at risk than might be predicted from the gravitational forces alone.
     In 1993, Jonathan Fink and I published a paper "Estimate of pyroclastic flow velocities resulting from explosive decompression of lava domes," Nature, v. 363, pp. 612-615, 1993.  In this paper we examined the two processes above, and concluded that the decompression process produces velocities comparable to those acquired by gravitational accelerations. In snapshots, such as that in the photo in this post, my guess is that the flow is clearly already some distance down the slopes of the volcano where it has assume the classic profile of a dense gravitational flow with air entrainment. More proximal regions have already been hit, and are, apparently, where the casualties have occurred. With the complicated sequence of recurring explosions/eruptions from the summit, it may never be possible to reconstruct the dynamics of the flows in the proximal region.
   

Monday, January 27, 2014

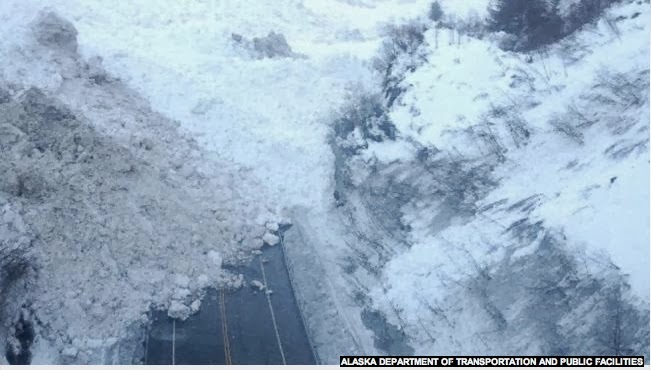
Avalanches block highway, isolate Valdez, Alaska


The avalanche on Richardson Highway near Valdez
Alaska Department of Public Transportation and
Public Facilities
Reuters photo from here.
Update: The road appears to have been reopened on Feb. 6.

Last Friday avalanches ranging up to hundreds of feet in length and 30-40 feet in depth blocked the Richardson Highway leading to Valdez, Alaska, a town of 4,000 people. This highway connects Valdez to the rest of the Alaska Highway system (however, supplies can be brought into the town by ship.) An even larger avalanche occurred on Saturday, and a 50 mile stretch of highway has been closed (it is impressive that it takes the helicopter nearly two and a half minutes to fly the length of the impounded lake and avalanches.) Here's a great video, courtesy of Josh Miller and Douglas Fulton of Vertical Solutions, of a helicopter flyover of the avalanches and impounded use/debris/water lake. There is some hope of digging the residents out by tomorrow (Tuesday), but the city officials are asking residents to plan to be there at least a week. There are multiple avalanches across the highway.
     One potentially serious problem is that one of the slides created a snow dam in Keystone Canyon that has impounded the Lowe River, and although some of the water is draining through an old railway tunnel, the potential for an ice-dammed lake breaking is real. The Alaska Department of Transportation says that it is too dangerous to work on clearing the slide until the lake drains because of fears that digging on the downstream side could trigger a surge of water. The National Weather Service issued a flood watch on Monday for residents downstream of the ice dam, saying that the ice dam could collapse with "little or no warning."
     According to the Alaska Avalanche Information Center more than 3" of rain on 24 hours, combined with abnormally high (above freezing) temperatures over the past 10 days caused conditions conducive to avalanching. Some reports suggest water up to 40' deep behind the ice dam.
    Much is being made of the fact that Valdez is much warmer than the mid-section of the US, currently experiencing another Arctic blast. Valdez has been in the 40's, and some parts of Alaska could even be in the lower 60's this week. Spring has, simply, started early in Alaska.


Tuesday, January 21, 2014

50' waves for Hawaii, and crummy surfing? What's the problem?

From CNN.com here, photographer is
Kent Mishmura, Getty Images.
When the surf is just right, surfers of the world gather in Oahu for "just one day of quality surf" when wave heights reach 40' or more, the largest waves since 2004.. The National Weather service has issued an gale warning that "An extremely large northwest swell will roll through the area Tuesday through Thursday." The significant wave height is expected to reach 20 feet (significant wave height is the average height of the highest 1/3 of the waves, and individual waves can be more than twice this value.) The large northwest swell is arriving Tuesday night, producing high surf along the north and west-facing shores of the islands over Wednesday and Thursday.
     I couldn't find any specific reference to the source of the northwest swell. There are two storms listed here, Tropical Storm LINGLING, and Tropical Depression INVEST, and I'm assuming that one or both are the drivers of the swell. However, neither of these is mentioned in the 1/21/2014 NOAA description of conditions appended at the end of this post. (Note that it discusses both big waves during the past week, and forecasted for the next few days.) NOAA attributes the waves to a low with hurricane force winds far to the northwest of Hawaii.

     Countering this driver of good big waves is a fast moving cold front approaching Kauai from the northwest.  This front will cause southwesterly winds to increase over Oahu and Lihue (the two northernmost large islands in the Hawaiian chain) over the next two days (Tuesday and Wednesday), and the winds will then spread southeast down the other islands. The front will produce gusty winds and the gusty winds will destroy the "quality" (a quote from Glen Moncata, the organizer of a potential big surf competition) of the waves required for prime surfing conditions.
    Aside from cancellation of a potential big surf event, there is a geologic implication in all this: beach erosion on the North Shore may be severe. It is an ongoing problem in Hawaii, and reports are that there are a number of North Shore homes that may be imperiled by the wave action.

The NOAA statement: of 1/21/2014:


SURF HEIGHTS WILL VARY BETWEEN DIFFERENT BEACHES AND AT THE SAME
BEACH AT DIFFERENT BREAK AREAS.
DISCUSSION:
Summary: overlapping winter caliber events.
Detailed: mid Friday on northern shores has extra large breakers, meaning surf on outer reefs, from 295-320 degrees with 12-17 second periods. Heights should lower on Saturday.
A strong jet stream has been steering a series of deep surface low pressure systems across the NW to N central Pacific since 1/11. This active pattern should keep events peaking above winter average levels arriving locally with a 1-2 days spacing 1/18-25.
A complex pattern produced the extra-large surf of 1/17. There were two remote separate low pressures cells and associated fetches and a nearby fetch area of gales. The longer-period swell from the remote sources peaked Thursday afternoon into the night. The nearby gales had significant westerly component, as seen by comparing peak wave heights from the Hanalei and Waimea buoys, 19 feet and 15 feet, respectively for overnight to morning 1/17. The more westerly component is shadowed on Oahu by Kauai. The second low pressure of the remote low cells had an associated captured fetch over the 305-320 degree band that stretched from the Kuril Islands to near 30°N, 170°W, or over 2200 nm, making for a long-lived event. Jason altimeter data from 18Z 1/16 in a region about 1000 nm away gives confidence for continued elevated surf on Saturday 1/18 from 305-320 degrees, nosing down below extra-large.
The complex pattern simplified to one deep low pressure cell that occluded near 40°N, 160°W on Thursday 1/16. The center of this low tracked N to the Aleutians by early Friday 1/17. Severe gales over the 340-360 degree band, and angular spreading from seas aimed E of Hawaii should allow moderate energy from 330-010 degrees building late Saturday, peaking Sunday, and dropping Monday.
Further west, a new low pressure cell intensified near 35°N, 175°E Thursday afternoon. This hurricane-force system crossed the dateline Thursday night near 38°N, and is modelled to be north of Hawaii near 40°N by Saturday morning. With a compact size and fast track, the fetch areas are limited in length and duration for growth of seas. The GFS input to Wave Watch III, ww3, predicts the peak near dawn Sunday morning with 12 feet at 17 seconds from 320 degrees. This forecast /was' predicting higher swell for two reasons. First, the ww3 has shown a low bias for sources of gale or stronger winds with fetch heads within 1000 to 1500 nm away. Second, there was a historic low pressure cell with similar track, track speed, size, and depth of central pressure January 8-9 2004 that resulted in Waimea buoy showing a short-lived maximum above 18 feet at 20 seconds on January 10, hence, giant surf. This duration of the most elevated heights is expected to be short, about a 12 hours, centered on late Sunday morning from 300-320 degrees.
However, Sunday morning update, overnight observations from buoy 51101 northwest of Kauai indicate that swell heights are not as large as originally anticipated, and are running slightly lower than Wave Watch III guidance. Therefore, this swell forecast has been lowered, closer to Wave Watch III guidance, for Sunday.
Surf should drop to within high to extra-large on Monday from 310-330 degrees as a new event arrives.
A new surface low pressure is piggy-backing the hurricane-force system near the dateline on 1/17. The new cell is modelled to be weaker with a E track about a day behind. Gales to severe gales are modelled to set up over the 315-330 degree band, reaching to within 1000 nm of Hawaii on Sunday. Forerunners are due locally Monday afternoon, with the event peaking in the wee hours Tuesday. Heights should slowly decline into Tuesday night as a new event arrives.
Models are showing a surface low pressure deepening to hurricane force west of the dateline 1/19, tracking east across the dateline near 40°N 1/20, continuing east to near 165°W near 40°N Tuesday, then turning north into Wednesday. This should make for giant surf by the wee hours 1/22 from within 290-330 degrees. The track, track speed, size, and depth of central pressure are similar to low pressure systems that generated giant surf locally of January 28, 1998, February 23, 1986, and December 1 and 4, 1969. It is too early for specifics, other than noting that this could potentially be the type of surf episode on order of decadal turn-around. This type of surf episode is not only well above average, but long-lived, on the order of 24-36 hours, which makes for greater coastal impact. Local tides will be in the neap phase 1/22-23 which offsets wave run up potential. It is worthy to note that Dec 1-4, 1969 saw extensive coastal wave wash under neap tide conditions, offset by the surf magnitude on order of 50-100 year turn-around.
Windswell through the period should be minimal from 40-90 degrees. See the latest NWS state weather forecast discussion regarding the gentle local wind pattern of varying direction. Moderate to fresh breezes 1/22 could bring small chop from 180-315 degrees 1/22.
The size of the present and upcoming surf events 1/17-25 can refract waves into most coastal areas of Oahu regardless of orientation.
Surf should increase from the southern hemisphere on Tuesday 1/21 from 190-200 degrees. A severe gale to storm-force fetch set up S to SE of New Zealand 1/13-14. New Zealand shadowed the fetch when winds were strongest. As the associated low cell tracked east clear of the shadow, winds weakened. Only a small episode is expected peaking Wednesday 1/22 from 190-200 degrees.
Into the long range, another fetch set up in a similar location and of similar strength S to SE of New Zealand 1/16-17. However, the head of the fetch reached further north to near 40s, or about 4000 nm away. This should give a notch higher surf locally, building 1/24, peaking 1/25, and dropping 1/26. There could be one more small, long-period event from 190-200 degrees locally 1/28-29.
In the northern hemisphere, extra-large to giant, declining surf from 300-340 degrees is suggested for 1/23. Winter caliber lows are expected to continue forming near 40°N in the NW to central N Pacific, with the next high to extra-large event hinted for 1/24-25 from 305-320 degrees. Minimal windswell from 40-90 degrees should hold 1/23-25.
Long range forecasts are subject to high uncertainty.
This collaborative forecast will resume on Tuesday, January 21.
This forecast was produced through the collaborative efforts of NWS and NCDDC. Please send suggestions to w-hfo.webmaster@noaa.gov or call the Warning Coordination Meteorologist at 808-973-5275.


Monday, December 30, 2013

Australian icebreaker nearing Akademik Shokalskiy ship in Antarctica

View from the Akademik Shokalsky a day ago
from the NYTimes.com 
Nearly a week ago, the Russian ship, Akademik Shokalskiy ship became trapped in ice in the Antarctic. The ship is an ice-strengthened expedition vessel, currently carrying both tourists and scientists studying environmental change near Cape de la Motte, about 1,700 miles south of Hobart, Tasmania. Strong winds pushed the ice pack against the ship, with ice thicknesses around 10 m. Earlier a Chinese vessel, the Xue Long attempted the rescue, but was frustrated by thick ice over the weekend.
The Russian icebreaker Krasin leading
an American supply ship into McMurdo Station
from Wiki here.
     Now, the Australian icebreaker, the Aurora Australis, is only 11 nautical miles from the ship and nearing a rescue. At the moment, the link above shows the view from the ships webcam! So, how do icebreakers work? The primary job of the icebreaker is to crush the icpack and move it aside whiteout becoming stuck itself. According to Marshall Brain on "How Stuff Works", an icebreaker has characteristics that help it do this: (1) a high-strength hull; (2) a large mass to help it maintain momentum so that it doesn't get stuck itself; and (3) power to overcome the drag of the crushed ice. Must be a noisy place!
     Here's a bit more from Wiki: The icebreakers push straight into the ice, breaking up the ice, sometimes even driving its bow onto the ice surface so that the weight of the ship helps break up the ice. The design of the hull is such that the broken ice is then directed around or under the vessel. The design is also optimized to minimize damage to the propellers and other parts of the icebreaker itself. Icebreakers have variously been steam-powered, diesel -powered, and nuclear-powered. They have been designed to function on rivers (e.g., in Europe) as well as on the open ocean. The photo shown next is of a successful rescue.

Sunday, December 22, 2013

On the fluid dynamics of gold, as in "gold, incense, and myrrh" this Holiday Season!

Gold leaf temples in Bagan, Myanmar
from http://images.smh.com.au/2012/01/27/2919441/art-Burma-Bagan-Temples-420x0.jpg
OK, so gold (a precious metal), frankinense (aperfume or incense), and myrrh (an oil) were given to Kings and other important persons in biblical times. Why? Gold, perhaps representing kingship; incense symbolizing a priestly role, and myrrh, a symbol of death and embalming.
     Well, let's stick to a more-or-less geological topic here, and look at the unique properties of gold, a substance so soft that it almost qualifies for discussion on this blog of "geology in motion." That is, let's look at how gold leaf is produced. It's a long involved process, involving human labor that has changed little in 5,000 years since artsans in Egypt recognized the ductility and its possibility for use. On this website, is the statement that the amount of gold that would fit inside a tennis ball is enough to cover (gold-leaf covered) the dome of the capital building in Atlanta, Georgia!

(In researching this, I discovered a Wiki article on the "Georgia Gold Rush" that might e of interest to the readers.
The Atlanta Georgia capital. The gold leaf was
added in 1958, with native gold leaf
from nearby Lumpkin  County,
where one of the
first American Gold Rushes occurred
in the 1830's.
Paraphrasing and quoting from here, the basic process is this:
Gold is typically mixed with an alloy such as silver or copper to make a grade of gold described by the "carat" system. Goldbeaters typically make 23 carat gold.
     The gold, along with its added alloy metals, are melted in a furnace, and then poured into a cast to make a bar. This bar is then put through a series of rollers, adjusted repeatedly until the bar becomes a sheet 1/1000 of an inch thick.
     But, this is not the end of the process. The gold is then cut into one-inch squares and beaten on large blocks of marble and granite, and, amazingly, ends up with a sheet that is only 1/2500,000 inch thick.
     Along the way, the gold has been cut into one-inch squares and been beaten by hammers. The first stage is referred to as the "cutch."  In it, about 150 skins (formerly ox intestines, but now, Mylar or parchment) surround the gold to hold it together during the beating. Finding something that can withstand the repeated pounding was a challenge. Blocks of marble and granite are used, sometimes placed onto the top of a tree trunk or set deep into the ground to create resiliency. The beaters spend an hour, using a 15-pound hammer and striking the gold about 70 times per minute, while also rotating and turning over the gold alloy packets to ensure uniformity in the expansion. Then, the beaten gold alloy is carefully removed and put into second packets of skins which are beaten for about there hours.
     At this point, the gold is thin enough that the cutter can simply blow on it to move it. (More details here because I'm skipping some.) Basically, at this point there still remains 3-4 hours of beating with an 8-pound hammer, to get pieces that are 1/250,000 thick. After this process, the result is 3.0x3.3/8 inch squares of leaves in tissue paper books that contain 25 leaves.
     Here's a video that shows parts of the process.
Happy Holidays!


Saturday, December 21, 2013

A National Weather Service "Critical Weather Day" !! Winter Storm Gemini!

National weather service map for 12/22/2013. Significant colors are: pink in the midwest=winter storm warning. Blue surrounding the pink is winter weather advisory; bright blue up in east Minnesota=severe weather statement. Green to the east of this =flood warnings; rust color east of the green = flash flood warning; yellow = tornado watch. 
The news is full of weather alerts for the central and eastern U.S. and Christmas travel is already a problem in the eastern half of the U.S. The east is basking in spring-like warmth, while the midwest suffers from temperatures below average. We who live in the Pacific Northwest are experiencing mild conditions at the moment, but will get our turn next week when rain/snow return here.  The full National Weather Service report is here.
     Temperatures are in the 20's across Oklahoma (southwest end of the pink/blue area)  while, not all that far away, they are nearly 80 degrees across Mississippi (yellow rain pattern). A big frontal boundary separates these two regions. According to the NWS, the severe icing now occurring in Oklahoma-Missouri will transition to light and moderate snow tonight, and the ice threat shifts to lower Michigan and northern New England.  Flooding is a major concern in some areas where the rainfall is more typical of April and May than December. Melting snow will contribute to the flooding.
     And, as if this isn't enough, tornadoes and straight line winds will continue in the lower Mississippi valley and into the Ohio Valley, much further north than usual for this time of year. Here's a link to a 5:59 p.m. EST warning about the thunderstorms and tornadoes. If the prediction holds, storms will be affecting a broad range of the midwest and even over to Washington DC by Sunday night.
     In researching this, I discovered something new about the NWS. At about 8:30 a.m., the NWS Centers for Environmental Prediction declared a "Critical Weather Day" from their station in Milwaukee/Sullivan. In the affected area their offices are not to make any equipment of software changes that might affect the work flow, i.e., do nothing that will cause the system to fail in this critical time. It is also routinely put into effect during Presidential elections and inaugurations.
     Take care, friends and readers, if you are traveling the next few days!

Wednesday, December 18, 2013

Europa, emission from oxygen and hydrogen, and inferred jets of water

In the blue areas near the south pole of Europa, a satellite of Jupiter,
aural emissions from oxygen and hydrogen have been
detected by the Hubble Space Telescope. NASA image.
Just as we have aurora at the north pole because charged particles enter Earth's magnetic field, Europa has an aurora at its south pole because it is in the intense magnetic field of Jupiter. When atomic oxygen and hydrogen are excited by the magnetic field, they produce an aural glow that can be detected spectroscopically. The oxygen and hydrogen have been interpreted as being the products of water molecules torn apart by electrons along the magnetic field lines.
Top row: Images of the hemispheres
of Europa; other rows: combined images of
the hydrogen and oxygen emissions. This is
Figure 1 in the Science Express paper


The measurements were made from Hubble Space Telescope in December 2012, nearly a year before reported this week in Science Express and summarized in this NASA press release. The scientists involved (Lorenz Roth et al.) have stressed the need for caution because the Hubble Space Telescope was "pushed to its limits to see this very faint emission." Scientists are excited about this for two reasons. First, if confirmed, it would mean that Europa becomes the second moon spewing out water plumes (Enceladus is the other). Second, because there is good evidence that an ocean of liquid water exists under the surface of Europa, the plumes would be a way to sample its composition without having to drill through a thick crust. (The evidence for subsurface water is in the surface morphology and magnetometer measurements.)
     The plumes vary in intensity with the orbital position of Europa, but not in a way that is easily explained. They are active only when the moon is the farthest from Jupiter, instead of the more logical position closest to Jupiter.  The scientists postulate that the cracks that emit the water are closed when Europa is closest to Jupiter, and open when it is farthest away. The plumes extend up to about 125 miles altitude and the erupted "water" falls back onto the surface rather than escaping into space.  In the figure to the right, the detected "jets" in December 2012 are compared with 1999 and November 2012 images when the particles were not detected. In December 2012 the plume was near apocenter, and the other two times, close to pericenter, lending support to predictions of tidal modeling.

Wednesday, November 27, 2013

How do elk swim? I think he walked over a bridge! His name is "Bruiser."

The Whidbey Island male elk
Image credit: Sasha Castaneda Whidbey News Times here
OK, it's definitely a fluid dynamics problem to figure out how a lone elk can land our elk-less island. Don't get ants in your pants, this is not post about how humans got to Easter Island or about genetic evolution. It's just a story about one lonesome male elk.
     I live on an island. There are three ways to get here: (1) drive over a bridge; (2) take a ferry; or (3) swim. It's 100% unlikely that this moose did not ride a ferry to our island, probably not quite so certain that he walked over the bridge.
     So, the common assumption in our local media is that he swam. But, if that's true, why didn't he swim back during rutting season? My hypothesis below is that he's actually not a good swimmer, that he didn't get here by swimming, and that he walked here. If that's true or even likely, we should shoo him back over the bridge so that he can not be so lonely! Having worked in Yellowstone National Park for many years, I can attest that (a) bull elk are not happy during mating season, and (b) that they will great distances for you-know-what.
     Here's the story: This handsome guy appeared on Whidbey Island in September of 2012, and is the only elk on Whidbey. He is probably a healthy bull in a mainland herd that no longer tolerated him. The common pattern would have been for him to find new land with a few accompanying females and start a new herd. But, here is now, alone on Whidbey. But, one year later during rutting season, he's still here?  According to the Washington Department of Fish and Wildlife, "the animal decided to stay put." But, is that realistic? If Bruiser could get back to the land of bountious females, would he actually "decide" to stay put? Not a chance in my experience with elk.
    So, what is going on? A healthy male elk lives about 15 years in the wild, and can weaight up to a half-ton. Like Bruiser in the photo, they can sport great racks (which everyone on Whidbey hopes will NOT become a target of illegal hunting--beware: there' a great island-watch on this guy....) How far would he have to swim?Elk are strong swimmers, aided by hollow hairs that keep them buoyant. During mating season, they "buggle" a mating noise that carries very long distances. You can see videos of them swimming, but if you Google "elk swim distances", there's no world record for an elk swim. They can definitely ford rivers, but is it an "easy swim" from the mainland to Whidbey as the Washington Department of Fish and Wildlife is saying?
   At best, this guy started in a herd in Skagit Bay on the mainland as Fish and Wildlife believes, he would have swum 4-5 miles direct from the Skagit tributaries to here. Not likely? At the very best, he'd have wandered up to Deception Pass (by himself, without his mistresses?) to Deception Pass where he had a narrow passage, but harrowing waters. If he got that far, why not walk across the bridge? On those autumnal days when there are few tourists, long dark nights, why would an elk near the bridge not just take a walk? It would certainly explain why he can't find his way home! What if Bruiser's females are just out of reach on the other side?
     It's clearly a fluid dynamics problem (Aside: traffic flow is a fluid dynamics problem) to reunite Bruiser with his herd! It's also an environmental problem because the Skagit Valley herd of 1700 elk have been driving Skagit Valley (mainland) farmers crazy over decades eating their crops. Fertile male elk are being culled from the herd by Federal, state, and tribal hunters, and they are authorized to kill 15 at the moment. Maybe Bruiser is a very clever elk.


Monday, November 25, 2013

To storm or not on this Thanksgiving?

The GFS model forecast by the National Weather Service
for 4:00 p.m. Thursday PST
taken from Cliff Mass's blog discussed in text
Hmmmmm...who to believe? If you read CNN.com here, you get the impression that Thanksgiving is going to be a mess. In fact, that article is on the front page of CNN.com with titles "Massive storm for Thanksgiving" and "A side of weather with your story." I was feeling smug that I am staying local for Thanksgiving, and so I turned for a local forecast to my favorite northwest meteorologist Cliff Mass's blog, which is particularly funny today and, as usual, educational.
    And, what did I find?An essay on the "lack of storminess and ill-weather" in the Thanksgiving prediction! Cliff usually takes on the Seattle Times, but he missed a chance to take on CNN today! If you read the text of the CNN article, you can see that they are talking about yesterday, today and Tuesday mostly, not about Wednesday through Friday, but the headlines are certainly misleading.
        The only place on the mainland to see significant precipitation is far NW Washington State and, Cliff says, "not many folks live there and most of those watch Canadian TV. In other words, they don't count!" (The comments posted today reflects that he has a tolerant readership up in that area of Washington!) He really is in good form in this post. High pressure dominates most of the nation, there are no low pressure systems influencing the mainland (there is one noticeable one off the coast of southern California). He also points out that today (Nov. 25th) is the 6th straight day without rain in the Seattle area, when the normal chance of rain at this time of year is 65%. It looks like we could squeek by through Wednesday without rain, with some moving in on Thanksgiving. That would be 8 straight days without rain, and according to him, the chance of that is about 3%.
       But there's more to the story. According to the National Weather Service Weather Prediction Center, Wednesday could be messy in the midwest and east coast. Temperatures will be 10-20 degrees below average in the central east coast and upper midwest regions, and a front over the Great Lakes will produce lake effect snow over the Great Lakes through Wednesday (this does bring back memories of Thanksgiving storms where I grew up in Northwester Pennsylvania, where we got the lake effect snow from Lake Erie). A storm developing over the Central gulf coast will move toward this Great Lakes disturbance to produce moderate to heavy rain that will move from the central Gulf Coast into the Appalachians by Tuesday morning. This system of rain will then move east to the Mid-Atlantic on Tuesday and expand into Northern New England by Wednesday morning. Snow will expand into the Lower Great Lakes Tuesday evening and Wednesday. So, in detail, it's complicated and worth reading the various forecasts/news articles carefully.
        As, Cliff also pointed out, Thanksgiving and the first day of Chanukah coincide this year, the first time since 1888, and the next time may be 77,000 years from now! Compounded with the fact that Comet Ison will be the closest to the sun and brightest that same day, as Cliff says , "Happy Thanksgivukkah", or maybe better, "Happy IsThanksgivukkah!"
       

Sunday, November 10, 2013

Typhoon Haiyan may have killed 10,000. 3D structure of typhoons; Carnot engine theory

Boat in debris in Tacloban on November 10
Photo by Aaron Favila/AP from here
Although confirmed estimates of deaths due to Typhoon Haiyan remain around 1200, there are now credible speculations that there may be as many as 10,000 dead in just one village. My condolences to the people of the Philippines, and best wishes that supplies reach you quickly.
       According to this Reuters.com article, 70-80% of the structures in the path of the typhoon were destroyed. Most of the deaths appear to have been caused by a debris-laden storm surge that swept away whole villages. The capital of Leyte province, Tacloban, lies in a narrow cove where storm surges can be focused toward the city. The storm surge appears to have surged at least a half mile inland.
Tacloban location

November 9, 2013 Super Typhoon Haiyan imaged by NASA Astronaut Karen Nyberg on NASA's ISS.
The country was not unprepared for this event, and it is sobering that so much damage could still occur.  A question not often addressed is: Are there storms simply too strong for even modern engineering to provide safety?  The heartbreaking scenes from this storm are so similar to those of the tsunami damage from the 2011 Tohoku tsunami that it appears the answer may be "yes."  Could people have survived if all buildings had been made of concrete, and made so tall that people could take refuge above the 15' high storm surge reported? Can concrete buildings be designed to withstand 250 kilometer per hour (155 mph) winds?
       What determines the intensity of a tropical cyclone? Remember: typhoon, hurricane, cyclone are just different words for the same phenomenon.  Tropical intensity is usually measured by the value of the maximum wind speed.  Here's a table of cyclone wind speeds from The Guardian:
From TheGuardian.com November 9, 2013
Haiyan, although the strongest cyclone to make landfall is the fourth strongest in terms of measured wind speeds.
       Kerry Emanuel, Professor of Atmospheric Science at MIT, specializes in hurricane physics (see several references to his work at ** below). A tropical cyclone is driven principally by heat transfer from the ocean. They generally develop over water whose surface temperature exceeds 26 C. They occur in three main belts generally within 5 degrees latitude. The cyclones then move westward and poleward at speeds on the order of a few meters per second. Cold water kills them as can unfavorable atmospheric winds.
       Emanuel is famous for, amongst other things, his analysis of hurricanes as a Carnot heat engine. The Carnot cycle is a basic concept in thermodynamics. A thermodynamic cycle is the set of thermodynamic conditions (such as pressure, temperature, entropy, enthalpy) reached in a system as energy is transferred from warm to cool regions. In the process, some of the energy is converted to mechanical work.
The Carnot heat engine of Emmanuel
Taken from the Physics Today article referenced at **

In the cross-section diagram to the left, the horizontal axis shows distance from the center of a cyclone, and the vertical axis shows altitude. The colors, from deep blue to dark red represent entropy, with the cooler colors indicating lower entropy. Evaporating sea water transfers energy and entropy from sea to air, and this causes air to spiral inward from A to B.  As it moves, the temperature of the air is nearly constant (an isothermal process), its volume increases as it flows toward the low-pressure core of the cyclone, and its entropy increases. The air then rises rapidly upward (in the eyewall) and outward, from B to C, so rapidly that the process can be considered adiabatic and isentropic (note how the path B-C lies within the constant yellow color). Once away from the storm center at C, the air generally mixes with other storms and is lost from the system, but in idealized models, the air radiates in the infrared wavelengths into space, a process Emanuel considers nearly isothermal, and so it loses entropy. The air then sinks again (D-A) and warms through (nearly) adiabatic compression (in the deep blues of constant entropy). This closes the Carnot cycle.
       Emanuel then shows that the velocity of the surface winds is proportional to the difference in temperature between the ocean surface and the high-level outflow (conveniently, 100 C in the figure shown) and the thermodynamic disequilibrium between the ocean and atmosphere, E, which is the difference between the enthalpy of air near the surface and of air in contact with the ocean.  Using these concepts, Kerry then showed (in a 2003) paper, that a limit on maximum sustained wind speeds is about 85 m/s or 195 mph. (He did not comment on the possibility of higher winds as shown in the table above.) He also showed that the average cyclone dissipates about 3E12 watts, equal to the total electrical power consumption in the US in 2000, and that an exceptionally large storm can generate an order of magnitude more power.

**K. Emanuel, Tropical Cyclones, Annual Reviews of Earth and Planetary Sciences, 31, 75, 2003.
**K. Emanuel, Divine Wind: The History and Science of Hurricanes, Oxford U. Press, New York, 2005.
**K. Emanuel, Hurricanes: Tempests in a greenhouse, pp. 74-75, Physics Today, August 2006.


Thursday, November 7, 2013

How does Super Typhoon Haiyan ("Yolanda") compare with Jupiter's Great Red Spot?

Updated: November 8, 2013

Super Typhoon Haiyan is now being called one of the largest storms ever. For a nice display of images of 13 of the largest storms, see here. Other posts on this blog related to this are: Super Typhoon Usagi in the Philippines just six weeks ago, including a Table of the Categories of hurricane (cyclone) strength; Tropical Storm Phailin and Thailand; and Cyclone Tracy and the Bill and Boyd song "Santa Never Made it to Darwin" (because Cyclone Tracy struck on Christmas Eve and Day, 1974).

Here is a link to Dave Petley's Landslide Blog that has a post today on the landslide potential due to the storm.

End of upate______________________________________
Super Typhoon Haiyan, November 7, 2013, 21:30 UTC
NOAA image
Super Typhoon Haiyan is headed toward the Philippines, due for landfall Friday morning (here's the CNN.com report on it). At the moment its winds of 195 mph with gusts up to 230 mph make it a Category 5 on the hurricane scale [Note: Weather.com put the winds somewhat lower--sustained at 134 mph and gusts to 155 mph]. (For comparison, we had a fairly major wind storm on Whidbey Island a week ago with winds up to 40-60 mph! Took down a lot of tree branches and some trees, caused power outages not only here but on the mainland for 8+ hours. Quite humbling to think of what it's going to be like in the Philippines.) This is the largest storm to date this year; its diameter is about 800 km (500 miles). For comparison with Yolanda, the most intense sustained winds appear to have been in about 190 mph in several typhoons (Typoons Tip, Grace, Vera, Sarah in the Pacific, and Hurricanes Allen and Camille in the Atlantic), so Yolanda is on-course to be close to a record-setter. More than 3800 people have been moved to evacuation centers, most from the central region of the Philippines. As shown on the adjacent map, the typhoon is projected to cross the South China Sea (to the west of the Philippines) and then hit Vietnam and Cambodia. It's speed has been 20-24 mph.
Path of Super Typhoon Yolanda
     The winds and rain from the storm are one thing, but there are other dangers. The island of Bohol in its path was hit by a magnitude 7.1 earthquake just a month ago. 350,000 people were displaced by that quake and are extremely vulnerable. Last December, Super Typhoon Bopha hit the southern Philippines, killing over 1000 people and affecting six million. A quarter million homes were damaged or destroyed. Landslides during storms in the Philippines are a constant danger.
Jupiter Great Red Spot NASA image
In the high resolution version of this image, objects as
small as 600 km (~400 miles) can be seen. Thus
Super Typhoon Haiyan, with a diameter of 500 miles--
would be a tiny dot just barely visible.
     According to the International Business Times, a Philippines government website specifically dedicated to disaster reduction was hacked just as the typhoon approached and, as of yesterday, was still not accessible. The website was supposed to provide Filipinos with real-time information about threats such as cyclones, tsunami, floods, landslides and fires, as well as providing general safety advice on preparation and surviving disasters.
     How do our earth storms compare to the Great Red Spot on Jupiter? This storm was first observed by Cassini in the late 1600's, and scientists believe that it is actually older than that. This is an anticyclonic storm (rotates anticlockwise) with a period of about six Earth days (14 Jupiter days). It's 24,000-40,000 km in EW direction, and 12,000-14,000 NS. It is large enough to contain 2-3 Earth's, so even our biggest storms don't compete! Winds around the edge of the spot reach 432 km/hour (268 mph).
    See the Figure caption to compare Super Typhoon Haiyan with the Great Red Spot!
   

Tuesday, October 29, 2013

Huge MegaWave off the coast of Portugal: video


Big wave of October 28, 2013 from Surfertoday.com
This wave is at the so-called Nazare North Canyon (Praia do Norte) Portugal

The news has been full of reports about the big storm that battered England and northern Europe the past few days. News is just coming out about surfers catching the big waves generated by the storm. In the photo above, the two men pictured are competitors in the goal of surfing the world's largest wave. In January, less than a  year ago, Garret McNamara (left in photo) surfed what was believed to be the biggest wave to date then, about 100 feet high. He had previously ridden a 78' high wave in 2011. Carlos Burle, right above, may have topped that record with his ride on a 100" high or greater wave on Monday. A video is here, and one with more wave mechanics is here. The official height of this wave hasn't yet been announced, but speculation is that it may be a new world record.
           What generates such waves? In my book "The Dynamics of Disaster" published last week by W.W. Norton Press, I have a chapter on ocean waves, and specifically on rogue waves. I'll highlight a few points here: What is a rogue wave? What happens as they approach shore?
            Rogue waves are quite ephemeral, and that has made scientific documentation difficult. In 1861, a wave broke glass windows 85 feet above the ground in an English lighthouse--after climbing up a 130-foot high cliff! This would imply that the wave was 215 feet high, but as of now, no wave near this height has been documented by eyewitnesses or with instruments. Rogue waves are generated by storms, and they are a danger to  shipping, fishing, tourism, and oil and gas production on the ocean.
           Here's a quoted footnote from my book that defines rogue waves: "To provide a reference for defining rogue waves, oceanographers have introduced the concept of a “significant wave height.” The significant wave height is the average wave height of the one-third highest waves in a time period (typically taken as 10-30 minutes). Surfers might find the following exercise useful--and sobering: ignoring the small stuff, sit on a beach and make a list of the heights of all incoming waves for 10-30 minutes. For example, 1 foot (1’), 2 feet (2’), 3’, 5’, 3’, 4’, etc. Organize this list from biggest to smallest: 5’, 4’, 3’, 3, ’2’, 1.’ Keep the highest one-third of the values, 5’ and 4’. Then, take their average--4.5.’ This is the significant wave height. A rogue wave is defined as one whose height is two or more times the significant wave height--9’ in this example. In fact, rogue waves with a height more than four times the significant wave height have been documented. In this example, that would be an 18’-high wave. Surfers who are comfortable with 2’ or 3’ foot waves, perhaps an occasional 5’ wave, but not with 9’ or 18’ waves need to be aware that such waves can appear at any time. This is apparently what happened when a wall of water collapsed on and killed the experienced big wave surfer, Sion Milosky, at Half Moon Bay, California, in March, 2011. After nearly an hour of relatively small swells (18-20’) for that day, a rogue wave “bomb” rolled him to the bottom, where he was held down not only by this wave, but by a second as well, in what is known as a “two wave hold down” in surfing jargon. He was found too late, 20 minutes later."
Map showing the likelihood of encountering
a rogue wave within any 24-hour period.
Courtesy Burkard Baschek
     (Sorry, but I'm not doing well at controlling line spacing in Blogger if this looks wierd)

Broad patterns of wind and ocean currents determine the zones of hazardous rogue waves on the ocean (as discussed more broadly in the book). Four factors can operate simultaneously to determine the height of he waves on the open ocean and near-shore: winds from hurricanes and storms that churn up the ocean surface; the interaction of strong waves moving in opposite directions, such as storm waves interacting with strong oceanic currents or strong opposing winds; constructive interference (addition of wave heights) of random waves; and piling up of waves from the deep ocean into shallow depths along the continental shelves. See book for details! And, it's that last effect that makes surfing so exciting!

Monday, October 21, 2013

Megafires: The New Norm

Sydney skyline with smoke. Photo is from cnn.com here.
Photographer is Gregg Wood/Getty Images
Fire is raging outside of Sydney, Australia, and today firefighters are saying that the hoped-for rain is not coming. They now fear that the 50+ individual fires will join to form a "megafire." NPR.com did a 5-part series titled "Megafires: The New Normal for the Southwest"last year (August, 2012) and you can link to it here. This summary is taken largely from that article plus some other references. The weather is dry, lightning abounds, and the last winter was very dry providing lots of fuel. The fires have already burned an area the size of Los Angeles.
     Fires are a natural part of ecosystems like those in the American Southwest and Australia. For a hundred years, the U.S. Forest Service had a policy of fire suppression that resulted in the accumulation of a large amount of brush. I'm not sure about the Australian fire suppression policies. However, because Australia sees cycles of droughts and floods, large fires have been a prominent part of the ecosystem evolution.
     In the Southwest, up until about 20 years ago forests had as many as 50 times the natural density of trees--typically, Ponderosa Pines (the ones whose bark smells like vanilla on a sunny day!). The forests resembled a thicket of giant toothpicks with mops of green hair on top. This was a result of the fire suppression policies. The Forest Service realized the problem that it had created and began to try to thin the trees by letting naturally started fires (e.g., those started by lightning strikes) burn when structures weren't endangered. They also started prescribed burns on days when wind conditions permitted this to be done safely. Such fires clear out the undergrowth.  However, people don't like smoke from such fires, and when the occasional one got out of control, the Forest Service was subjected to law suits and so they burns were cut back.
     Firefighters are now being quoted in the press as saying that the megafires are something new, that they've fought big fires before but nothing like these.  According to Thomas Swetnam, a tree ring expert at the University of Arizona, old trees show scars of fires that burned them, but didn't kill them. Back in the 1600's such fires occurred about every 5-10 years--small grass and shrub fires that left the big Ponderosas and Doug firs alive. But then "around 1890-1900 the record stops--the "Smokey Bear effect."What happened? The Civil War had ended, Reconstruction was nearly finished, and the Manifest Destiny doctrine resulted in the westward expansion. Settlers brought livestock that ate the grass, so fires had little fuel. Then the U.S. Forest Service was formed and, as Swetnam says, "its marching orders were 'no fires.'"Expert wisdom was wrong. (You can see a time-laps series over 88 years showing changes in a forest landscape here.)
     The result was a Southwest with forests packed with trees, shrubs and grass--fuel. When fires start in forests with these conditions, the immense heat that they generate actually precooks fuel in front of an advancing fire by drying it out.
    There are, broadly, three types of fires (this classification comes from the U.S. Forest Service and is specifically for conifer forests, but general enough to apply here): ground or subsurface fires; surface fires; and crown fires. Ground or subsurface fires spread slowly without visible flames. Surface fires can spread with the wind or upslope (so-called "heading surface fires") or into the wind or downslope (so-called "backing surface fires.") Crown fires advance both through the tree tops and through over the surface. The transition from a surface fire to a crown fire is a significant escalation in the fire intensity, particularly because convection increases allowing embers to be spread far away from the initial fire. Three types of fires are shown in the figure below (taken from the USFS report referenced above).

   Forest fire fighters have developed various ways to try to anticipate fire conditions. Van Wagner (see the USFS report mentioned above) hypothesized that the type of crown fire to be expected in a conifer forest on any given day depended on three properties of the canopy fuel layer and two basic fire behavior characteristics. The Fire characteristics are the initial surface fire intensity and the rate of fire spread after the onset of crown combustion. The three properties of the canopy are the foliar moisture content, the canopy base height, and the canopy bulk density. The initial surface fire intensity, the foliar moisture content and the canopy base height determine whether or not the fire will ignite the foliage of the conifer, and the canopy bulk density and the rate of fire spread after crown combustion determine whether the fire can be sustained in the canopy.  The initial surface fire intensity and rate of fire spread in turn depend on windspeed, slope steepness, fuel dryness, air temperature, relative humidity and fuel characteristics. Models such as these are put together in various graphs to illustrate fire potential.
Van Wagner's diagram for fire classification
     Wagner's graph is illustrated here. The abbreviations are: Rate of spreading (ROS) and critical rate of spreading (ROScritical) and Surface fire intensity (SFI) and critical surface fire intensity (SFIcritical). The trap shows that if the surface fire intensity is low, then there is no crowning, only surface fire. If the surface fire intensity is high, then crown fires develop. They are either passive (if the ROS is low) or active (if ROS is high).

Saturday, October 12, 2013

Tropical Storm Phailin (Phailin means sapphire in Thai)

Projected route for Phalin from Accuweather.com
at this link
Today another superstorm has attacked India from the Bay of Bengal: Tropic Cyclone Phailin has hit northeastern India. Hundreds of thousands are either fleeing or being forcefully evacuated. Winds over 100 mph, and flooding in excess of 8" are expected, along with storm surges of up to 20 feet near the shore where landfall occurred.   Winds were in excess of 125 mph at the point of landfall at Golpalpur. The US Navy's Joint Typhoon Warning Centre predicted that Phallin could produce gusts up to 184 miles per hour.

Phailin and related geography
From The Weather Channe
In 1999, Cyclone Odisha struck and estimates are that up to 15,000 were killed. Up to this date, Odisha was the strongest tropical cyclone ever recorded in the Indian Ocean, and was the deadliest since a cyclone hit Bangladesh in 1991. It was a category 5 storm and followed a category 4 storm in the same general area by only a few weeks. Tens of thousands fled. The storm surge was 26 feet and it traveled up to 20 km inland.Nearly 7,000 square miles of crops and 90 million trees were destroyed. Nearly 1.7 million people were left homeless. Estimates are that up to 45,000 people died, but the official count stood around 10,000. Many people died of starvation and disease after the storm.

Since Odisha, authorities have vowed to reduce deaths and enforce mandatory evacuations. The area encompassed by the cyclone is home to millions of people. Most live in mud and thatch houses. The army is on standby and helicopters and food packages are being prepared for relief operations.

I have discussed hurricanes and cyclones in a number of other posts (see, for example, here; you can search the blog for others), so here are a few new facts (from the Hindustan Times reference given below).

In contrast to naming of hurricanes in the Atlantic, starting in 1979 cyclones in the Northwest Pacific are named in very different ways. By and large, personal names are not used. The majority of names refer to flowers, animals, birds, trees, or even foods, and some are descriptive adjectives. The names are selected by contributing nation, with the selection being from a list of the countries in alphabetical order.

I've been asked whether any good ever comes of disasters, and hopefully, the Indian's response to this one will be an example. In 1999, only tens of thousands were evacuated from this same area. This time it is hundreds of thousands. Let thoughts and prayers for success in their efforts fly across the ocean to those in the path of Phailin.


Here are more links:
Accuweather
BBC 
Hindustan Times